Posts

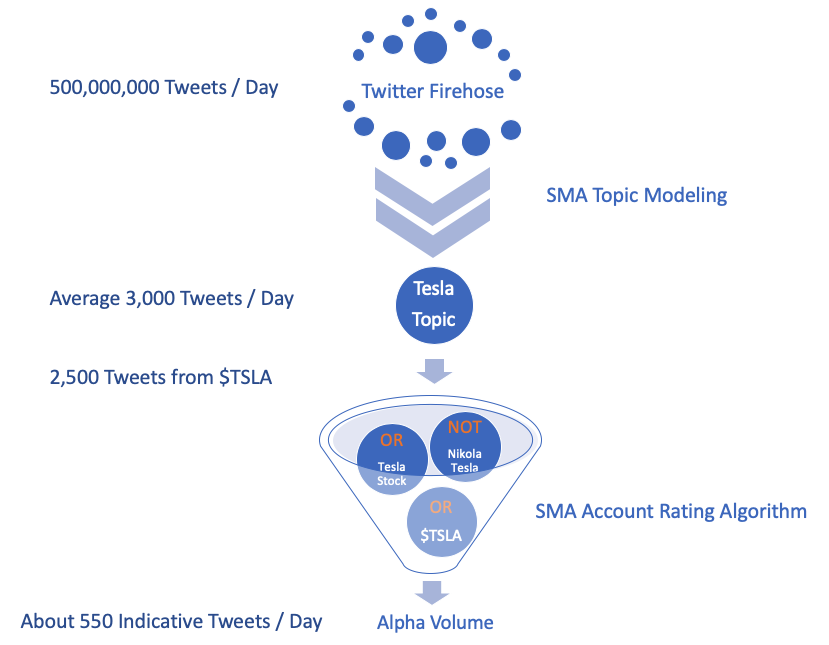
At Social Market Analytics we use proprietary techniques to return the most accurate Twitter volume for topics of interest.  First, we use a topic model not just $Ticker.  Most vendors use the CashTag concept to identify securities.  At SMA we believe only using CashTag excludes a lot of valuable conversation.  We return higher volume and cleaner conversations because we use a machine learning rules based system to return all conversations about a security that are not tagged with $Ticker.  In the diagram below we return about 500 extra Tweets a day for Tesla Motors versus just $TSLA.  Our topic model evolves with the conversation over time.

After applying our topic model filter we additionally filter Tweets based on our proprietary account validation metrics.  Only Tweets from our SMA approved accounts are included.  In the below example, there are about 500 Tweets for Tesla Motors from the certified accounts per day.   These accounts pass our multi-step algorithm.  One metric we use is weighted accuracy over time.  For example, when a Twitter account is bullish on a security what percentage of time does that security subsequently move higher.

Below is a visualization of SMA Twitter filtering process for the Tesla topic.

Below is a time series of Tesla Topic model versus $TSLA with the additional filter for SMA certified accounts.

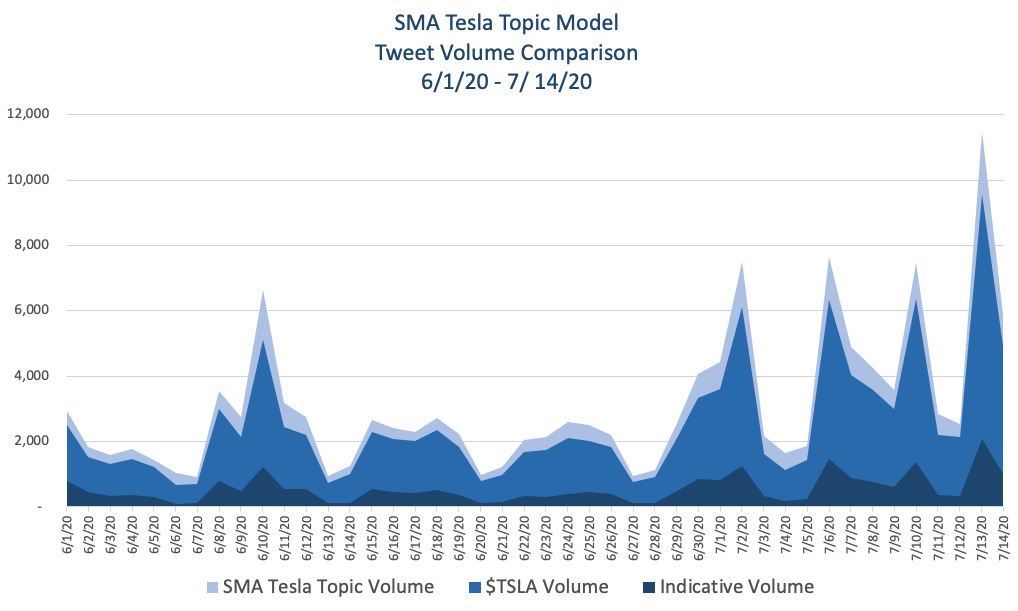
As you can see from the charts SMA’s proprietary technology provides the truest view of the each securities topic model.  To learn more about our technology or receive a sample data set ContactUs@socialmarketanalytics.com.


Social Market Analytics has extensive Intellectual Property in three distinct areas:  Topic model creation, account filtering and natural language processing (NLP).  I have written blog post about SMA topic model creation capabilities and the impact of our account filtering algorithms.  This blog answers the question – “Do your machine learning algorithms really add value to the NLP process?”.  Answer -> Yes. The chart below illustrates the statistically significant benefits of Social Market Analytics Machine Learning Algorithms in isolation. 

Start date for this analysis is 11/20/2018 and the end date is 4/30/2019.  This period was chosen because of the significant market draw down in December.  We use dictionaries with three distinct rule sets.  We use a static dictionary as of the start and end dates and compare resulting predictive returns with a point-in-time dictionary (production).  Our patented NLP scores Tweets using the dictionaries at each time, S-Scores are calculated from the generated Tweet scores.  The point-in-time dictionary represents word additions, phrases, and grammatical logic as they are made. 

We isolate the impact of our NLP process by turning off account filtering applied to the Twitter stream.  To ensure we are pulling Tweets only discussing companies and securities, we are using our topic model filtering algorithms.  We regularly publish our full return charts to illustrate the impact of our entire process. 

Let us start by defining the lines in our chart.


Red Line = Tweets are scored using our dictionary of words and phrases as of 11/20/2018.  This illustrates the performance with no machine learning applied on a go forward basis. This is the base case. This line represents the least amount of learned information.

Black Line = Tweets are scored using words and phrases applied Point-In-Time.  This is the production feed SMA customers receive.  We use Supervised and Unsupervised Machine Learning.  There are impacts from both during this period.

Green Line = Represents the Perfect Information scenario. Take the most up to date dictionary of words and phrases (4/30/2019) and apply them backwards.  All information learned during the volatile period is included.  This represents the values expected to be received on a go forward basis.

The charts below represent the cumulative Open to Close return of securities selected based on S-Score 20 minutes prior to market open.  S-Score measures the tone of the current conversation relative to historical benchmarks.  We select securities with an |S-Score| > 2.  Securities with S-Score > 2 are purchased on the open.  Securities with S-Score < -2 are sold short on the open.  SMA Chart lines represent a theoretical long/short portfolio. Isolated long and short sides are available upon request. 

For comparison purposes S&P 500 open to close chart for the analyzed period is below.

The chart below illustrates the cumulative O-C performance illustrating the impact of our ML algorithms.  As expected, the lowest performance is the red line representing the dictionary at start date.  The back line represents SMA production data and green line represents the perfect information case. 

Again, this only looks at the impact of SMA NLP and does not include account filtering.  At SMA we believe it’s not just what is being said but who is saying it.  We employ a twelve variable algorithm to score and filter all Twitter accounts Tweeting about companies/securities to identify our approved account universe.  As you can see SMA NLP is a learning system with demonstrable impact.  To learn more please contact us at contactUs@SocialMarketAnalytics.com.

Thanks,

Joe

Social Market Analytics aggregates the intentions of professional investors as expressed on Twitter.  We apply our patented filtering and natural language processing(NLP) to Tweets to proactively select Twitter accounts to use in our predictive metrics.  We track several metrics to gauge the predictive nature of our dataset.  For this blog I am going to illustrate one of these metrics.

2018 was a rough year for the SP500, it lost about 9% (rolling one year).  Given market loss and the high volatility we thought it would be an ideal dataset over which to run an experiment.  Two questions we get regularly are: How would your data perform in a bear market?  And what is the benefit of your NLP and account ratings systems? This blog will answer both questions from the perspective of 2018 market performance.

The table below illustrates performance of six theoretical portfolios.  These portfolios represent stocks with Social Market Analytics S-Scores of 2 or higher (Long signal) or Social Market Analytics S-Scores of -2 or lower (Short signal).  S-Score compares the tone of current Twitter conversations with average tone of Twitter conversations over the last twenty days.  Social Market Analytics has multiple baseline for multiple prediction periods.

Each security in our universe represents a proprietary Topic Model.  Each Topic is a collection of rules used to include or exclude specific Tweets from security buckets.  For example, if you are looking for Tweets about Ethan Allen furniture (ETH) you do not want to include Tweets about Ethereum Crypto Currency (Also symbol ETH) conversations.

We created portfolios with our account filtering algorithms and compared them with portfolios of all twitter accounts discussing our Equity Topic Models. The purpose of the run was to quantify the ability of our patented account filtering algorithms to identify professional, and hence more accurate, investors. Spoiler alert: Our account filtering improved the long/short return by 50% (18.73 for 2018 versus 12.53 NLP only)

NLP applied only:

The NLP only portfolios illustrate the power of our NLP process to accurately identify and fine grain score Tweets discussing securities and companies.  Our patented process reads each Tweet multiple times to identify if and how strongly someone is voicing a view of expected future performance.  The NLP only portfolios illustrate the predictive power of our NLP in isolation.  When you apply the Account filtering you get a predictive boost.

Account Filtered + NLP applied:

Account Filtered plus NLP portfolios illustrate the benefit of applying our account filtering metrics.  Early in the life of Social Market Analytics we learned its not just what is being said on Twitter but who is saying it. We developed proprietary metrics to identify investors more likely to be correct about the future direction of a security. When the conversation of these professional investors is significantly more positive than the average conversation over the last 20 days those securities significantly outperform.  When the conversation of these professional investors is significantly more positive than the average conversation over the last 20 days those securities significantly underperform.

 Portfolio Construction

Portfolios are constructed of securities with an S-Score of 2 or higher (long) or -2 or lower (short).  All portfolios are equally weighted.  A negative value for a short portfolio denotes a positive return to that portfolio.  Short portfolios are supposed to move lower.  All securities are entered on the Open based on a 9:10 am Eastern time S-Scores and exited on the Close.  There is no overnight exposure.

Result Analysis

We use SP500 as our performance benchmark.  SP return is calculated from open to close in the same manner as the selected securities. Using open to close performance the SP500 returned -16.89% for comparison.  As you can see from the table the S-Score > 2 outperformed the market and negative S-Score securities significantly underperformed the market (generating positive alpha).  The L/S portfolio with NLP only returned +12.54%, NLP plus account filtering improved that performance by 50% to +18.73%.  We do not illustrate this as a single factor model but removing 10% a year for slippage and commissions still significantly outperforms.

nlp-accountratingPlease contact us with any questions or to see how SMA’s NLP and filtering capabilities can be used in your investment process.  ContactUs@SocialMarketAnalytics.com