Social Market Analytics converts textual data into quantitative signals for the investment community. To complement our U.S. Equity feed, we recently launch a Twitter based sentiment feed covering the largest TSX (Toronto Stock Exchange) equities. The initial universe included 233 TSX equities, and recently expanded to include an additional 200+ equities. The out-of-sample date for this dataset is January 20th, 2022 with history extended back to the beginning of 2020.
Similar to other asset classes in SMA’s database, the TSX asset class publishes Activity, S-Factor, Short Squeeze, and Hard to Borrow data feeds. To test the robustness of this new asset class, we conducted Daily Quintile and Threshold tests on the S-Factor feed.
TSX Equities Quintiles
In this Quintile test we look at SMA’s S-Factor feed at 3:40 pm ET (20 minutes prior to Market Close). Stocks are placed into different Quintile buckets based on the value of their S-Score. The S-Score is one of fifteen factors supplied in SMA’s S-Factor feed and provides a daily view of Social Sentiment from Twitter. S-Scores greater than 2 or less than -2 are considered extreme sentiment, while values closer to 0 indicate neutral sentiment. The lowest 20% of S-Score values are placed in Quintile 1 while the highest 20% of S-Score values are placed in Quintile 5. We look at subsequent Close-to-Close returns with each stock equally weighted within each quintile. Below is the daily cumulative return series of the TSX asset class quintiles.
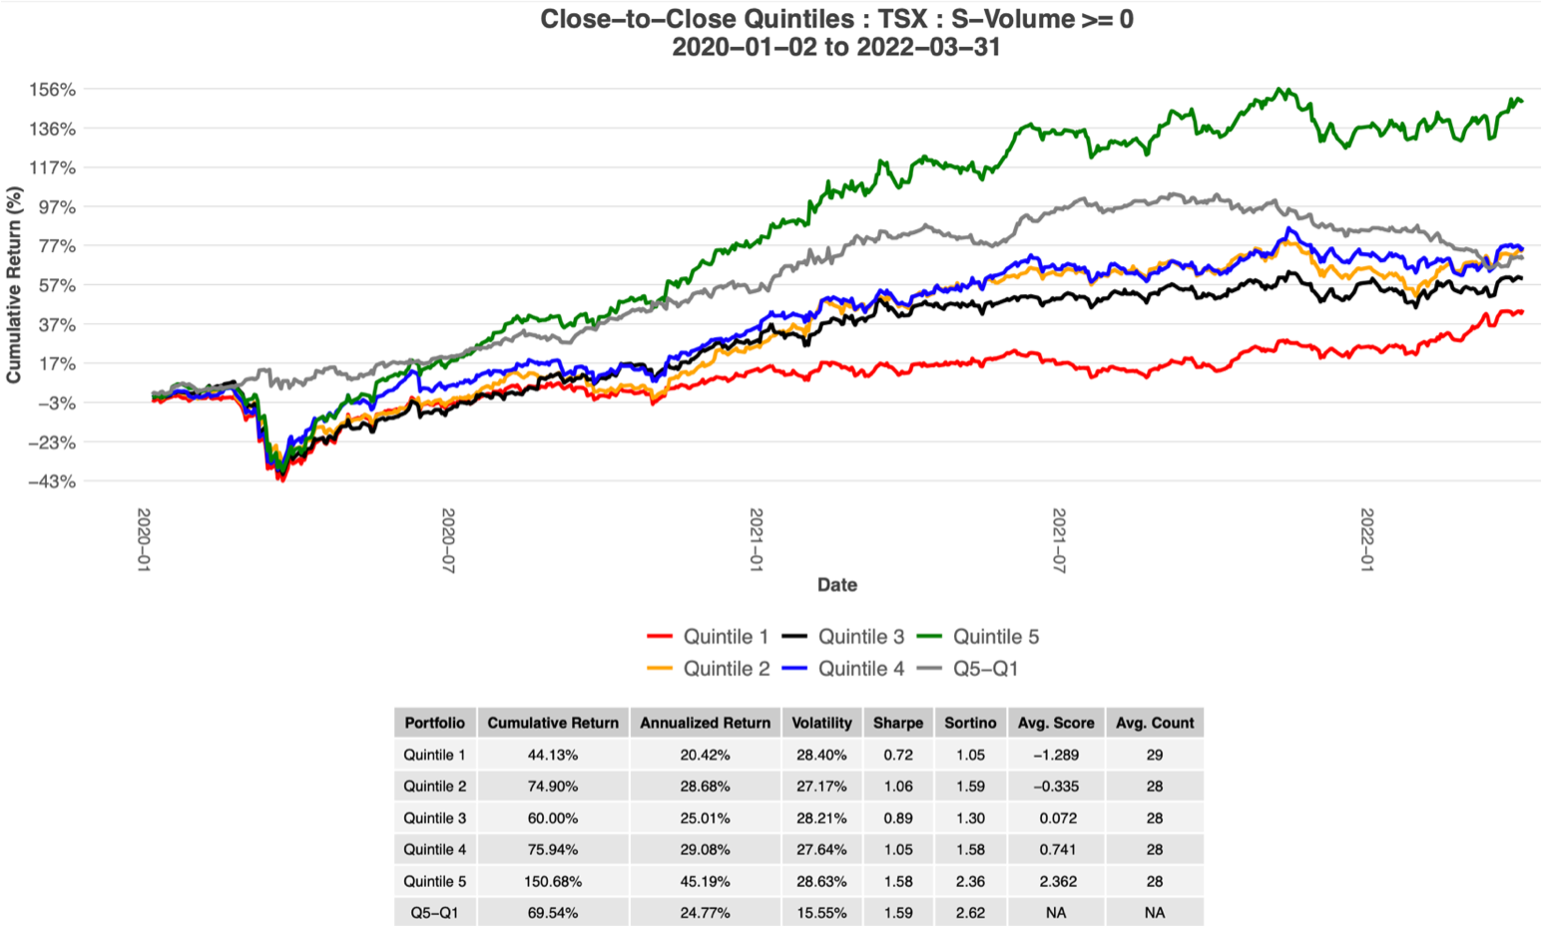
After placing stocks in their proper Quintiles and taking the average return of each bucket, stocks with higher S-Scores tend to outperform stocks with lower S-Scores. The graph above shows a monotonic factor. This graph includes a large spread between Quintiles 1 and 5, which would result in a cumulative return of nearly 70% in 27 months. On average, the TSX asset class publishes 141 securities each market day. This number will only increase as SMA’s TSX universe expands.
We further explore the S-Score signal by filtering on securities that had 3 or more Tweets within the previous 24 hours (S-Volume >= 3), then conduct the same quintile analysis.
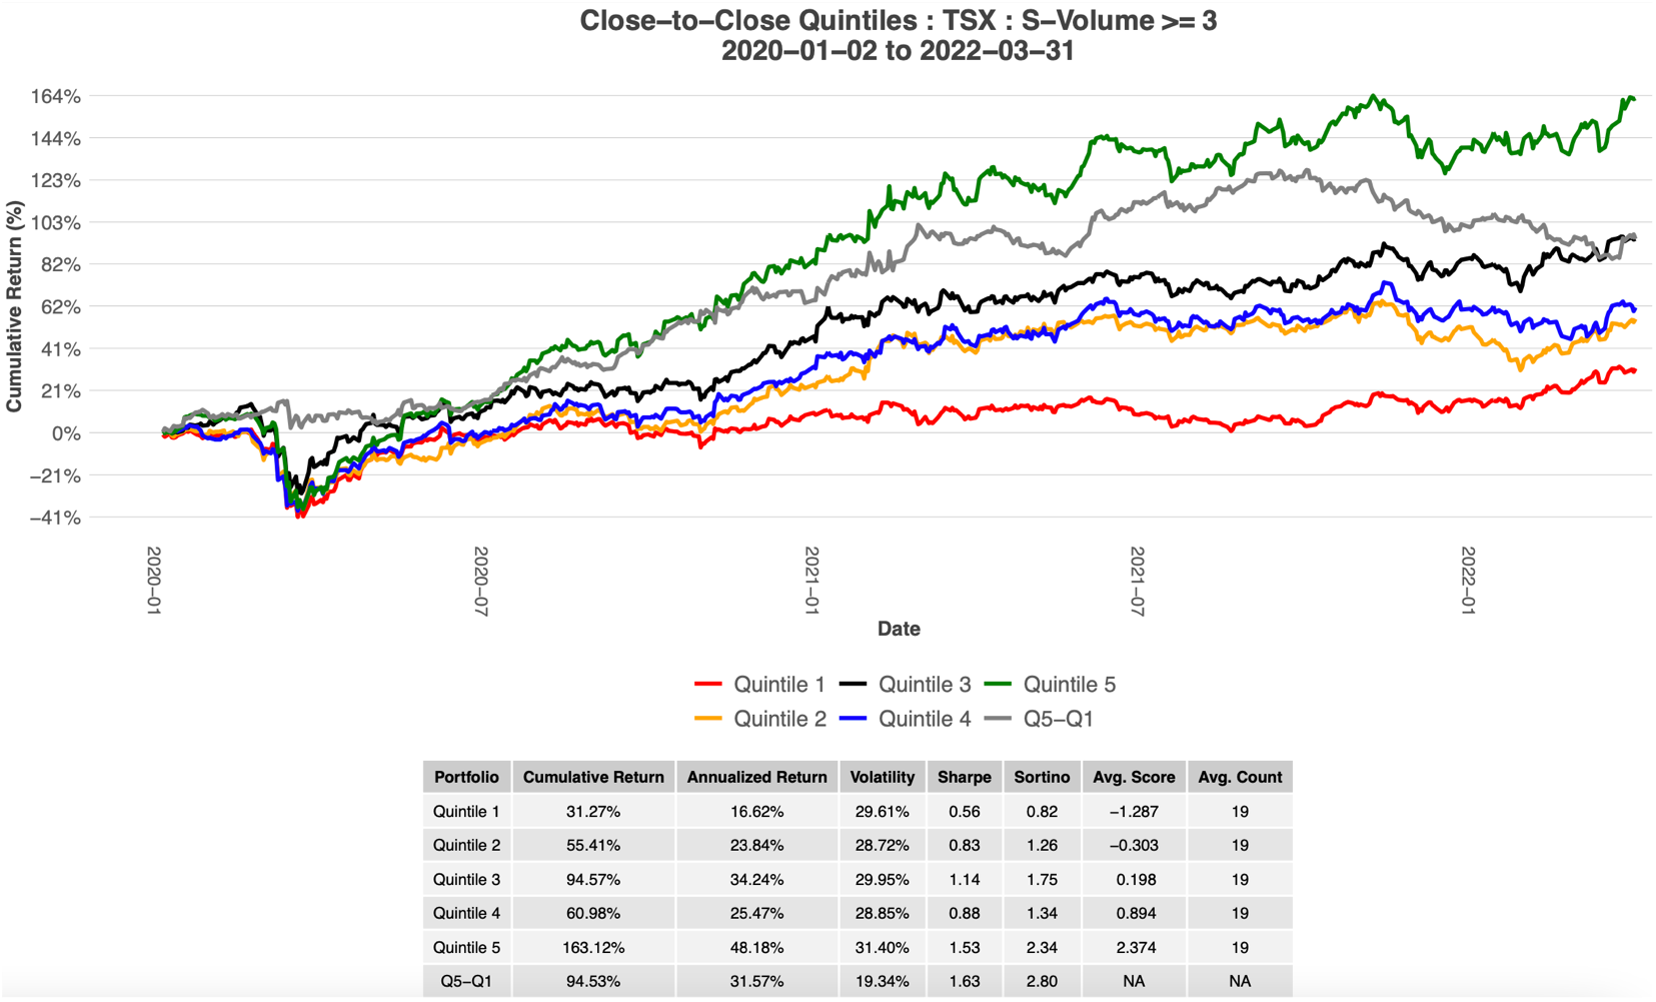
This new filter reduces the number of securities distributed in the graph from 141 to 95 securities each day. However, it also increases the Sharpe ratio and spread between Quintile 1 and Quintile 5.
TSX Thresholds
For this test, we look at all TSX securities at 3:40 pm ET and place securities in the ‘Long’ bucket if their S-Score >= 2 and place securities in the ‘Short’ bucket if their S-Score =< -2. Since 2020, there are an average of 5 stocks per day in ‘Short’ bucket and 17 stocks per day in the ‘Long’ bucket. We look at the subsequent Close-to-Close return for each security. Securities are equally weighted within each portfolio. In the Long/Short portfolio, the Long and Short baskets are equally weighted.
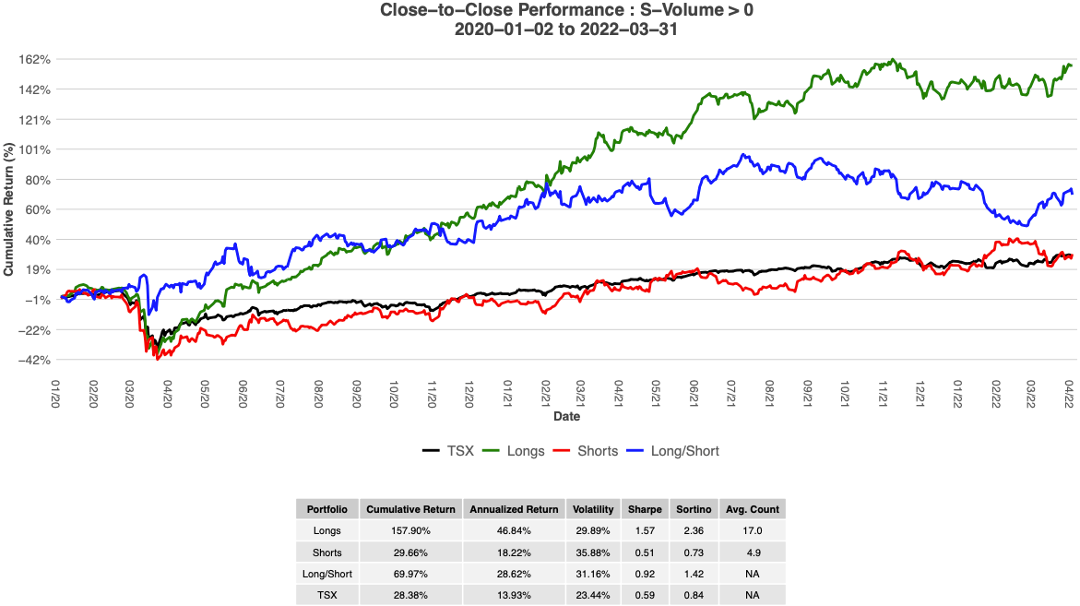
When only looking at securities with S-Score >= 2, the annualized return of this portfolio is greater than 45%. This portfolio also has a Sharpe Ratio of 1.57 which is well above the market benchmark (S&P/TSX Composite Index).
Many insights can be extracted using SMA’s TSX Social Media feeds. To find out more on this topic, email us at ContactUs@SocialMarketAnalytics.com or schedule a meeting using our 1 on 1 Meeting Signup.