Posts

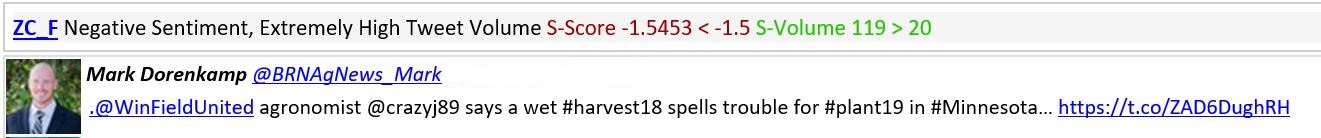
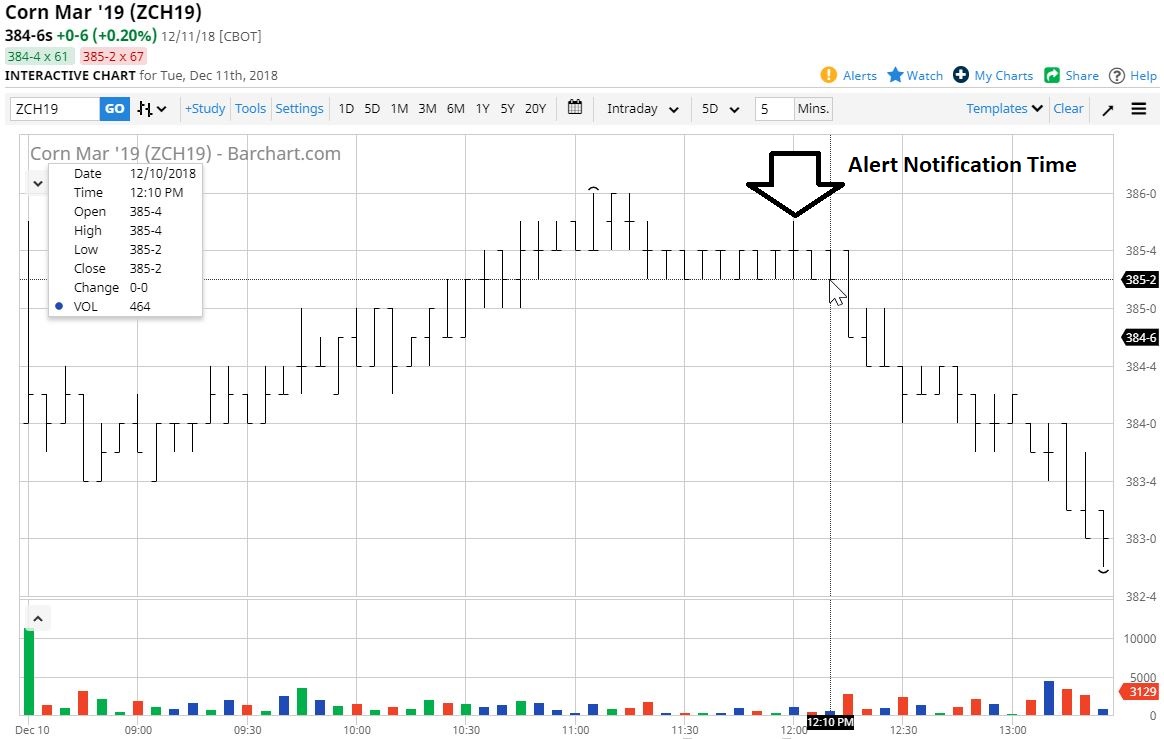
Social Market Analytics (SMA) tracks real-time sentiment on equities, commodities, currencies, ETF’s and crypto currencies.  SMA has the most powerful and customizable Alerting API combining Twitter sentiment and pricing metrics.  Users receive custom real-time sentiment alerts on instruments in their watch list.  For example, on December 11, 2018, SMA’s alerting system sent an alert on Corn at 12:12 pm CT when corn was @ $385.25. Below is the email and mobile alert.

Cornalert

Mobile

Subsequent to the alert, corn moved lower starting at 12:17pm CT. The price continued to move lower the remainder of the day and closed at $383.25. (See chart below)

Corn Alert

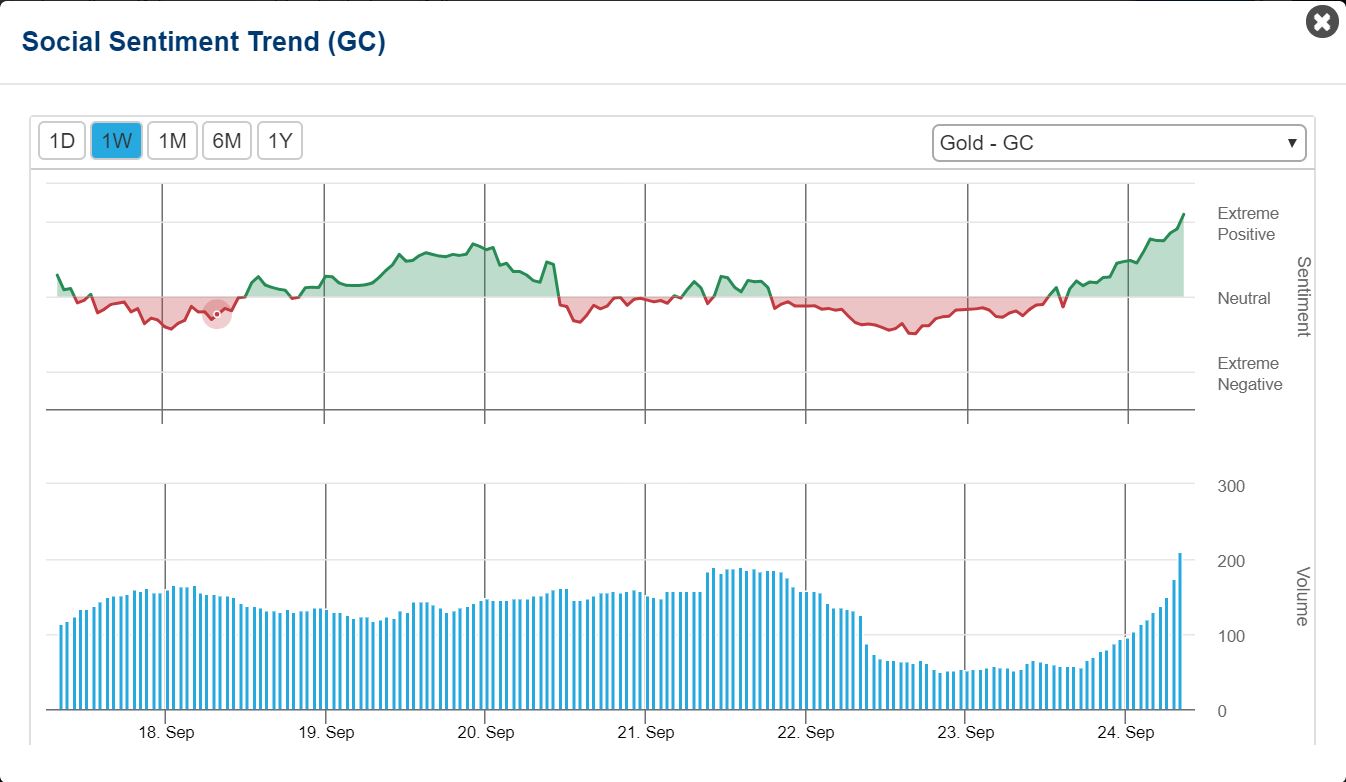
The above alert was based on SMA’s rolling 24-hour sentiment. SMA also calculates a Long-term sentiment with longer price projection periods.  Corn’s long-term S-Factor flipped from positive to negative on November 14th. 12/10 was the first day the long-term S-Factor for corn reached a significantly negative level of -1.5 standard deviations more negative than the longer-term baseline conversation. For more information please contactUs@SocialMarketAnalytics.com

This year has been tough for most investment strategies.  Firms using traditional sources of data are generating the same underwhelming returns.  Two years ago, Social Market Analytics, Inc.  (SMA)  (Twitter)   launched the SMLCW index in partnership with the CBOE.  This index is re-balanced weekly and comprised of the twenty-five securities selected from the CBOE large cap universe with the highest average S-Score over the prior week.  It’s A long only index of super-cap stocks with unusually positive Twitter conversations.

SMA publishes a family of metrics providing a full representation of the Twitter conversation across equities (US and LSE), commodities, currencies, ETF’s & Cryptos.

S-Score is a normalized representation of the current Twitter conversation of professional investors as identified by Social Market Analytics patented algorithms.  SMA has access to the full Twitter feed through our licensed partnership with Twitter and listens in real-time for any mention of topics and securities of interest.  These Tweets are scanned in real-time for sentiment and influence of the poster and compared to prior conversations over the look back period.  Securities with higher S-Scores subsequently outperform and securities with negative S-Scores under-perform.

SMA S-Scores are predictive over multiple prediction periods.  With seven years of out-of-sample data we can extend our comparison baselines and predict over longer periods.

Year-To-Date the SMLCW index is up over 7.5% while the SP500 is flat.  Subtracting a couple percent for commissions/slippage and the index is still significantly positive. This is not a back-test, this index has been live and on your quote screens for nearly two years.  YTD actual performance chart from the CBOE site is below.

SMLCW - YTD

As mentioned, this is a long only index.  During the recent market drawdown this long index has been performing.  SMA negative S-Score stocks have been moving lower at a significant rate – generating positive alpha.  Below is a chart of the SMLCW index compared to the SP500.  for any questions or to learn more please contact us at:  ContactUs@SocialMarketAnalytics.com.

Thanks,

Joe


Social Market Analytics, Inc. (SMA) has been the leading provider of predictive quantitative signal in the alternative data space for 7 years. Over the years, we have developed patented algorithms that use machine learning and natural language processing to provide content that generates alpha. Our NLP is unique because of our proprietary processes that tag sentiment weights based on the language used in finance per asset class. The processing of tweets for futures and commodities is different from what we use for equities.

There have been a lot of conversations around Natural Gas futures in social media lately. Through our partner CME Group , people have been monitoring social sentiment from SMA in real time on their active trader site.

Recently, we did as study on using SMA signals to create a Long Short trading strategy using Natural Gas futures. In the example here, we are using front month futures contract and trading daily using a combination of S-Score (a measure of unusual sentiment) and SV-Score (a measure of unusual twitter volume activity).

The strategy buys contracts when the sentiment (S-Score) is positive. We scale up the long position when the sentiment is positive, and the volume of tweets is also significantly high (SV-Score). Conversely, when the sentiment is negative, we sell contracts and go short. We sell more contracts when sentiment is negative with significantly high number of tweets. For this study, we use a maximum of 100 contracts when going long and 100 contracts when taking short positions.

The sentiment strategy performs significantly better than the Natural gas prices, returning 87.42% YTD. We also avoid the volatility in the price and get a Sharpe of 3.53 on the strategy.

NG

A PnL curve of investment of $300,000 in 100,000 contracts on Jan 1, 2018 is shown in the chart below.

The strategy is profitable throughout the  period, and the maximum drawdown is only 7.19%, which is significantly better than the 29.72% drawdown in the natural gas prices YTD.

NG2

Social Market Analytics (SMA) publishes real time Twitter based sentiment for nearly 300 crypto currencies including Bitcoin.  To view Bitcoin sentiment values and 35 other commodities in real time, go to the CME Active Traders website.   Twitter based sentiment has proven to be strongly predictive for Bitcoin and other commodities.

Today we will review a sentiment-based Z-Score strategy to generate profitable trades for Bitcoin.  This is similar to traditional standard deviation band strategies calculated with price.

When Twitter volume from certified investors is abnormally high use the sentiment of the abnormally large conversation to select entry points.  Strategy overview is below:

CMEBitcoin 1

A visualization of the strategy is below. When the Z-Score of Social Market Analytics Indicative Twitter volume is greater than the threshold and the tone of the conversation is significant enter or modify trades.  Sentiment  > 2 standard deviations and the volume of the conversation is high enter a position.  Positions are modified based on further extensions of the Z-Score.

CMEBitcoin2

Test period is from 1/1/2017 to current.  Overall results below.  For more detailed results on this and other strategies contact ContactUS@SocialMarketAnalytics.com

CMEBitcoin3

SMA has examples of profitable applications of Twitter based sentiment to many coins.

Social Market Analytics (SMA) data is live on the CME Active Trader Website.  Real-time sentiment and indicative Twitter volume is used by traders to generate new ideas.  Sentiment data is predictive across various time frames.  High sentiment commodities go on to outperform and negative sentiment commodities underperform.  SMA covers 36 commodities on the CME website for: Agricultural, Equity Indexes, Energy, Metals, Interest Rates & FX.

On Monday 9/24 Gold Sentiment crossed through extreme positive at 7:30 am central time.    https://activetrader.cmegroup.com/Products/Metals

GoldBlog1

Clicking on the chart expands the time frame for further analysis.

GoldBlog2

To learn more about Social Market analytics commodity sentiment data or more about the CME implementation: ContactUs@SocialMarketAnaltics.com.

To receive alerts like this in real time follow us on Twitter at @sma_alpha.