Posts

Machine Readable Filings (MRF) Extract the Significance of ESG in Future Earnings

August 4, 2020

Discussions of Environmental, Social and Governance (ESG) has grown exponentially in the last few years. Socially conscious investors believe ESG criteria better determine the future financial performance of companies. There is a growing number of ESG funds, ETFs and other products based on ESG. To determine whether the increase in ESG discussions have influenced company operations, SMA analyzed the breadth ESG mentions in SEC Filings using ‘Machine Readable Filings’ (MRF).

Social Market Analytics, Inc. (SMA) has partnered with S&P Global Market Intelligence on ‘Machine Readable Filings’ (MRF). MRF is the first product to provide parsed textual data of SEC Edgar Regulatory Filings at the Item, Section, Sub-section, and Notes level with historical baselines back to 2006. Extraneous information such as page numbers, images, and tables are removed.  SMA is currently developing the same structured data on International Reports which will be released in Q4 2020.

SEC filings are formal documents reported to the U.S. Securities and Exchange Commission (SEC) that contain important information about Companies, such as Management Discussion & Analysis and Risk Factors. Every U.S. publicly traded company is required to submit regulatory filings.

SMA’s proprietary Topic Modeling allows us to analyze mentions of ESG within MRF, while filtering out the unfitting noise. The ESG Topic Models captures every mention of “ESG” within SEC filings, including related terms using statistical synonym capabilities while filtering out mentions of “ESG” where it does not apply to Environmental, Social and Governance. For example, mentions of an internal group called Energy Services Group abbreviated as “ESG” in Halliburton Company’s regulatory filings would not be included in the ESG Topic Model. The ESG Topic Model flags the filings matching the topic model criteria since 2006 and extracts the textual context of the mention of the ‘ESG”-related phrase to analyze who is talking about ESG and how they are talking about it.

The first step in analyzing the dataset was to see the trend since 2006. In order to see the growth in conversation of ESG, we charted the total number of unique documents each year, based on the year the document is published. The chart demonstrates exponential growth since 2006. The least number of documents published in a year that mention ESG was in 2006 with 12 documents and the most is in 2020 with 481 documents as of July 23. The total amount of documents mentioning ESG since 2006 is 1,502.

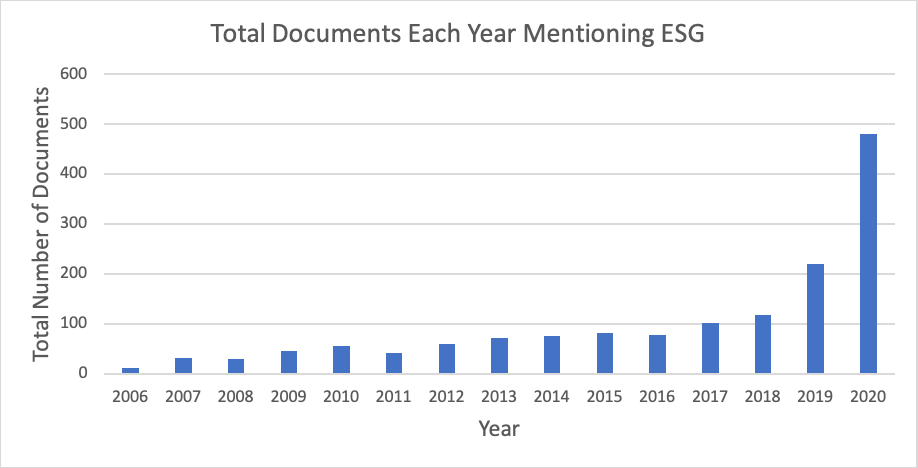
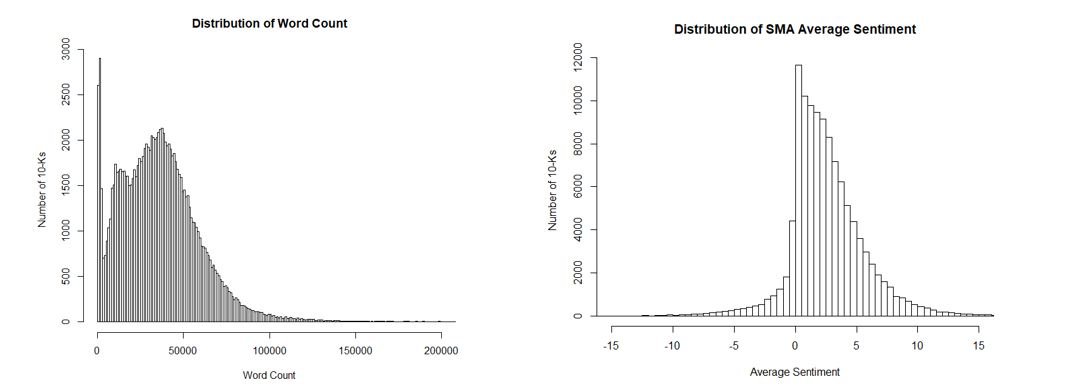
When companies mention ESG in their filings, the mentions tend to be in 10-Ks where companies typically go into the most detail. Of the 1,502 documents that mention ESG, 683 documents were 10-Ks or 10-K/A and 291 were 10-Qs or 10-Q/As. There are about 3x as many 10-Qs total than 10-Ks because of how often they are reported each year. 2020 is by far the largest year, and more companies will mention ESG in 10-Q filings reported over the next two quarters. Occasionally 8-K filings will mention ESG when there is a new ESG initiative or update.

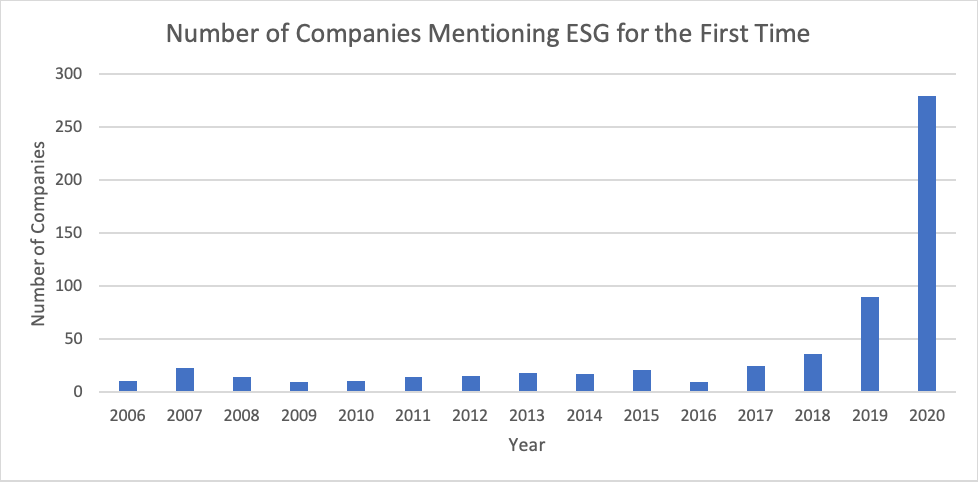
In order to validate that few companies are not releasing many filings mentioning ESG, we calculated the number of unique companies mention ESG each year. The number of unique companies each year shows parallel exponential growth to total documents. ESG initiatives are spreading across many companies.  There are a total of 597 different companies reporting filings that mention ESG since 2006.  This validates that the documents with mentions of ESG are not dominated by few companies. It also makes sense there is not bias towards one company because most of the documents mentioning ESG come from 10-K filings which companies only release once a year.

We then wanted to look at when companies mention ESG for the first time. Almost half (279/597) of the companies in our dataset were flagged by the topic model for the first time in 2020. Between 2006 and 2018, new companies mentioning ESG for the first time in their filings was between 10 and 36. In 2019, the amount of new companies mentioning ESG in their filings jumped to 290, almost tripling the highest year before. In 2020, that number more than tripled again. Still only 579 companies have mentioned ESG to date which is about 15% of publicly traded U.S. companies.

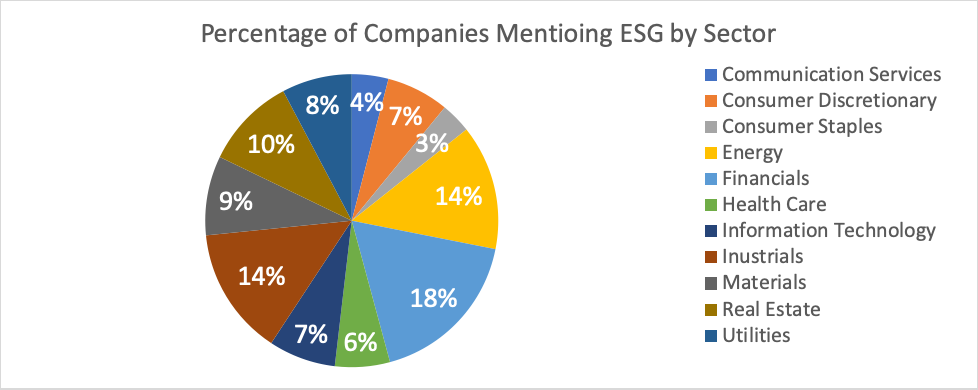
Since few companies are mentioning ESG in their filings, we then looked at the data by sector to see if there is a trend. The three largest sectors mentioning ESG are Financials, Energy and Industrials. The Financials industry primarily talks about products offered or investments in companies that are thought to value ESG more. Energy and Industrials could be companies that are required to practice environmentally friendly procedures within their business model. The two smallest sectors are Communication Services and Consumer Staples. The two sectors are not as impacted by economic cycles, therefore could be more resistant to economic trends.

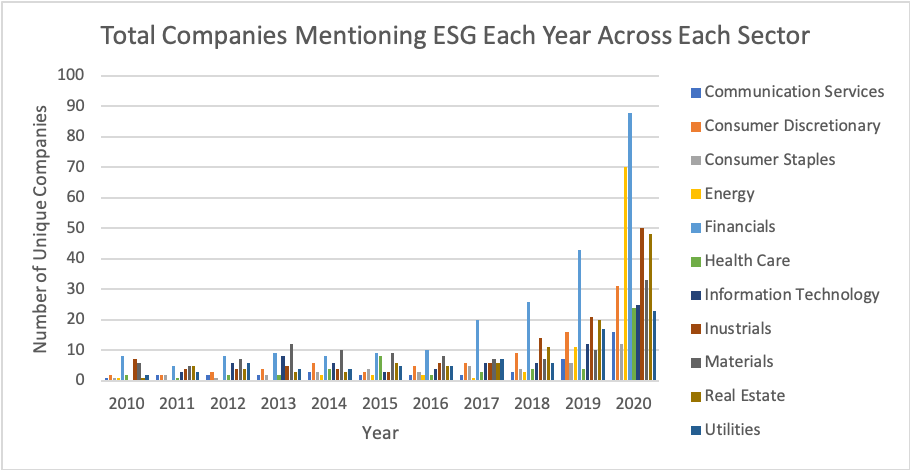
After looking at the share of companies mentioning ESG by sector, we decided to see if there was a trend over time. The Financials sector has been the clear leader in having the most companies mention ESG in filings for the last 5 years. However, the second leading sector, Energy, had not been nearly as high until 2020. Before 2020, the Energy sector had an average of less than 2 companies per year mentioning ESG in their filings and had only the 7th most companies mentioning ESG in 2019, which indicates there may have been an increase in public or investor pressure to mention ESG in their filings. Prior to the surge in the Energy sector mentioning, the Industrials and Real Estate sectors had been going back and forth for the last couple years for the second and third most companies that mention ESG in their filings. The growth rate was much less spontaneous than the Energy sector.

ESG is a growing topic for both Companies and Investors and has been increasing exponentially within SEC filings. The number of companies mentioning ESG in their filings has been growing dramatically over the past four years. We expect this trend to continue as investors become more socially conscious in their investing. Companies tend to discuss ESG in their most detailed documents, either 10-Ks or 10-Qs. The sectors mentioning ESG the most are Financials, Energy, Industrials and Real Estate. The greatest recent surge in companies has come from the Energy sector. Utilizing MRF and the Topic Models built to analyze the dataset, Firms can get a better picture of which companies are truly ESG conscious.

As the breadth of companies widens and the depth of ESG mentions increase in Filings, we believe ESG will drive investor returns. We believe MRF will become an important tool for Asset Managers to evaluate ESG as part of their investment strategy. In future blogs we will explore the relative return of companies with and without ESG principles.

For more information about Social Market Analytics ContactUs@SocialMarketAnalytics.com. By David Stolz

In April 2020, S&P Global Market Intelligence and Social Market Analytics, Inc. (SMA) launched ‘Machine Readable Filings’ (MRF), a sophisticated textual data offering which applies Parsing and Natural Language Processing to generate machine readable text extracted from SEC Regulatory Filings. Machine Readable Filings allows businesses and investors to incorporate more qualitative measures of company performance into their investment strategy by using machine readable text from full or individual sections of regulatory filings to enhance their analysis of companies. The parsed textual data allows firms to drill down on both historical and new filings in near real-time.  My last blog introduced the product and illustrated some basic return characteristics present in filings word count.

This blog explores the predictive nature of filings using SMA patented NLP and machine learning. For our analysis we used all active securities with a price greater than 5 dollars. Our analysis starts in 2006.  Securities are broken into quintiles based on each factor.  These factors are samples of the extensive metrics that can be created with this data.  Quintiles are re-balanced monthly based on each company’s most recent filing. 10-Q’s are compared to prior 10-Q’s and 10-Ks are compare to prior 10-K’s.  These are not meant to be trading models. They illustrate the predictive power of the data and use as broad a universe as possible. Two interesting distributions are below: distribution of word counts for 10-K (mean 36,000) and distribution of average sentiment.  As you can see companies try and keep the 10-K as upbeat as possible.

Our first factor is Change in Sentiment Hits. Sentiment hits are the number of times our NLP was able to identify a word or segment in a sentence. Positive hits + Negative hits + Neutral hits.  The green line represents filings with the largest increase in sentiment hits while the red line represents filings with the largest decrease in sentiment hits. Large increases in sentiment hits tend to under perform and large decreases in sentiment hits tend to outperform its peers.

The quintile performance characteristics are below.   Although quintile 2 and 3 are out of order you see the average values for those quintiles are near zero.  Quintile 1 outperforms quintile 5 by 3% annualized.

The next factor we are analyze is what percentage of the document does the parser hit.  Many filings are filled with general information not necessarily providing meaningful statements.   The green line represents filings with the highest percentage of sentiment hits in the document while the red line represents filings with the lowest percentage of sentiment hits in the document. A higher percentage of sentiment hits tend to  outperform and a lower percentage of sentiment hits tend to under perform its peers.   Companies with documents containing more meaningful content outperform companies with documents with less meaningful content by about 3.5% annualized.

Quintile 5 – Quintile 1 annualized is 3.5%

The third factor we are exploring is changes in negative hits.  Companies with increasing negative hits are discussing more negative information than prior quarters, they subsequently under perform.  The green line represents filings with the largest increase in negative hits while the red line represents filings with the largest decrease in negative hits. A large increase in negative hits tend to under perform and a large decrease in negative hits tend to outperform its peers.

The last factor we explore is cumulative document sentiment.  Quintiles are based on summations of all sentiment hits in the document.  More common analysis of sentiment is by section.  We identify parts sections and subsections in this product providing a myriad of ways to analyze the data.  At the most aggregated level sentiment is predictive.   Document length has a large impact on overall sentiment.  Z-Scores of this factor are a good way to compare prior documents.  As you can see in the chart companies with more positive total document sentiment tend to outperform companies with more negative total sentiment.

Quintile 5 outperforms quintile 1 by 1.7 percent annualized.

There are many ways to analyze the MRF data set. Filings are parsed by Item, Section, and sub-Sections to 2006 for historical back testing. This analysis looked at only 10-K’s and Q’s ‘Machine Readable Filings’ (MRF) cover 20 types of SEC filings. This blog covers a small portion of the research. The U.S. SEC Edgar Data is live on the S&P Xpressfeed. International Reports will be released later in 2020. To learn more or to start a trial please ContactUS@SocialMarketAnalyitcs.com.

Visit Our Website

S&P Global and Social Market Analytics today launched Machine Readable Filings (MRF), a sophisticated new data offering which applies Parsing and Natural Language Processing to generate machine readable text extracted from SEC Regulatory Filings. Machine Readable Filings allows businesses and investors to incorporate more qualitative measures of company performance into their investment strategy by using machine readable text from full or individual sections of regulatory filings to enhance their analysis of companies. The parsed textual data allows firms to drill down on both historical and new filings in near real-time.

Machine Readable Filings features the following:

  • 23 Years of History
  • 48,000+ Companies
  • 20 Filing Types
  • 4 Million Documents

The product feed contains three levels of detail:

  • Parsed Filings
    • A normalized JSON of all financial documents. Parts, Items, and subsections are normalized
    • Document and Section Summaries
  • Summaries for each section and the whole document, with their respective changes over time, including
    • Word Counts
    • Numbers of Positive Words
    • Numbers of Negative Words
  • Sentiment Feed
  • Full Patented SMA Sentiment Feed and associated metrics

As regular readers will attest, my previous blogs have focused on NLP and parsing Twitter and StockTwits based messages. This blog breaks new ground for Social Market Analytics as our first piece featuring Machine Readable Filings. We processed all 10-Ks and 10-Qs mapped to a pricing source (~150,000 documents) and looked at subsequent returns based on two word count based factors.

The word count factors we explored were Raw Change and Magnitude Change. Raw Change is the difference between the number of words in a filing and the number of words in the most recent filing of the same type for the same company. Magnitude Change is the absolute value of Raw Change, so it does not account for the direction of change. Below is the formula for the factors created where i represents the company, j represents the filing type (10-K or 10-Q), and k represents the period of the filing.


First, we looked at the Management Discussion & Analysis (MD&A) section because this section has the largest variability across all companies. This section addresses the company’s performance in a qualitative manner. Each value is carried forward from the previous filing until a new filing is released or until the data is 3 months old. The chart below represents a Quintile plot of Magnitude Change of word count in the MD&A section from January 2010 to December 2019.


Quintile 1 contains filings with the least amount of change in the MD&A section. Average Magnitude Change of word count in MD&A section for the lowest quintile group is 118 words. Quintile 5 represents the largest Magnitude Change of word count in MD&A section. Average Magnitude Change of word count in this quintile is 3,073 words. This graph shows that in the MD&A section, smaller changes in word count tend to outperform the market and larger changes in word count tend to underperform the market. The hypothetical Long/Short of this variable (Q1 – Q5) is proven significant at a 95% confidence level meaning the average monthly return is greater than 0%.

Next we looked at how changes in word count across an entire document can impact future returns. The largest increases in the number of words in the total document is represented by the green line. The largest decreases in word count is represented by the red line.


As you can see if there is a large increase in the number of words in the document, the stock subsequently underperforms its peers. On the other hand, if there is a large decrease in word count throughout the document, the stock tends to outperform its peers.

Although this analysis only includes the change in word count of the whole document and the MD&A section, other sections within regulatory filings can provide additional insights into a security’s future return. Furthermore, we expect additional insights to be uncovered using natural language processing to quantify the sentiment of the underlying text at the various levels of the document. These analyses and more will be explored by Social Market Analytics and S&P Global in the future.

S&P and SMA are excited about the launch of this new product. This is the first product to break out documents into component parts and provide a full historical analysis. To learn more about or schedule a trial please ContactUs@SocialMarketAnalytics.com.