Wow, what a ride 2015 was with the S&P 500 closing slightly down for the year. As we head into 2016 are you going to continue to look at the same factors as everyone else or maybe try something new?
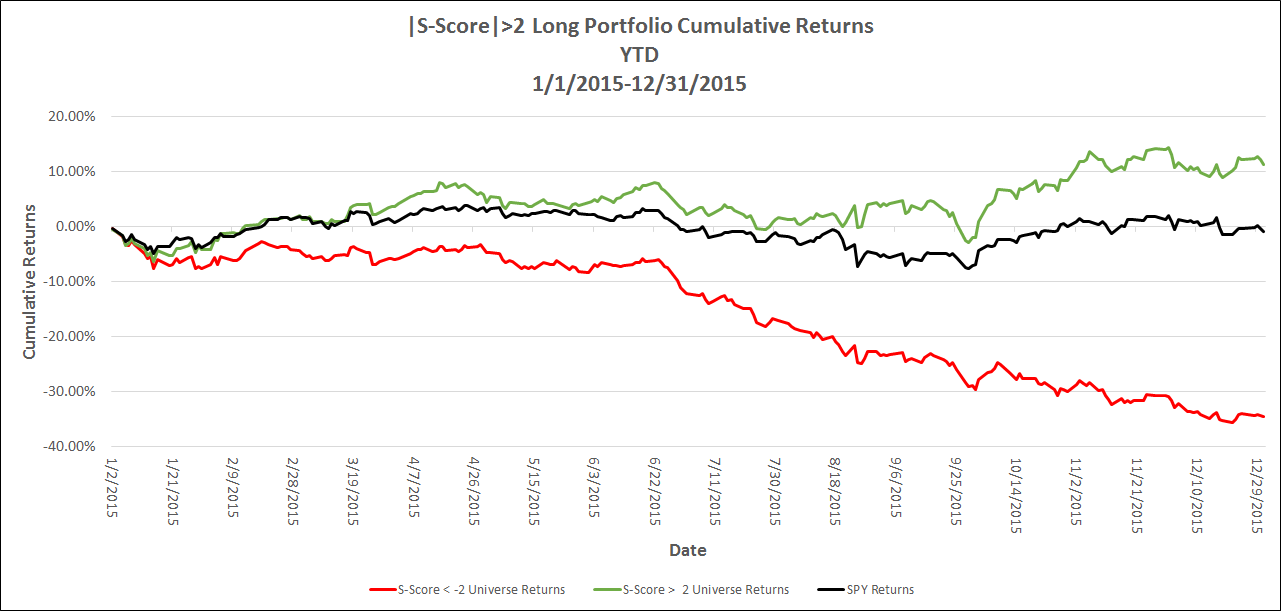
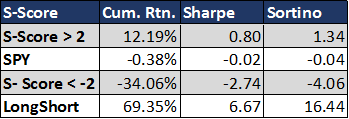
Below are the returns for stocks with significantly positive and negative pre-market open S-Scores. Stocks with High pre-market open sentiment scores had a cumulative return of 12.19% versus an SP 500 open to close return of -.38%. Stocks with a low pre-market open sentiment score had a cumulative open to close performance of -34%. Stocks with high sentiment scores outperformed and stocks with low sentiment scores under-performed. With significant Sharpes and Sortinos. Combining S-Factors with your selection criteria and risk management can add a dynamic new factor to your security selection.
These charts use the S-Factor S-Score. SMA publishes and family of S-Factors to clearly identify the tone of the social media conversation. To learn more go to: https://socialmarketanalytics.com/process.
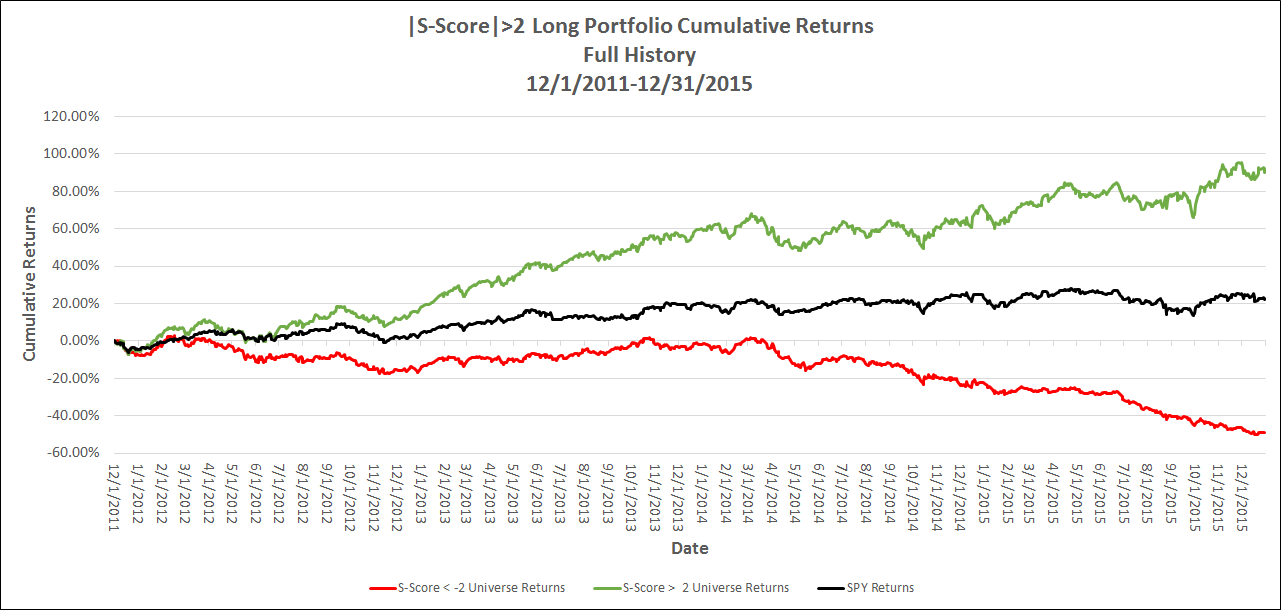
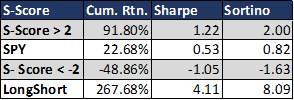
Social Market Analytics has been publishing the performance characteristics of stocks with high and low sentiment over the last four years. Last year it was difficult to find success with traditional factors. SMA S-Factors helped our customers generate out-performance. Please contact Social Market Analytics to explore how sentiment based factors can be included in your models: ContactUs@SocialMarketAnalytics.com.