Posts

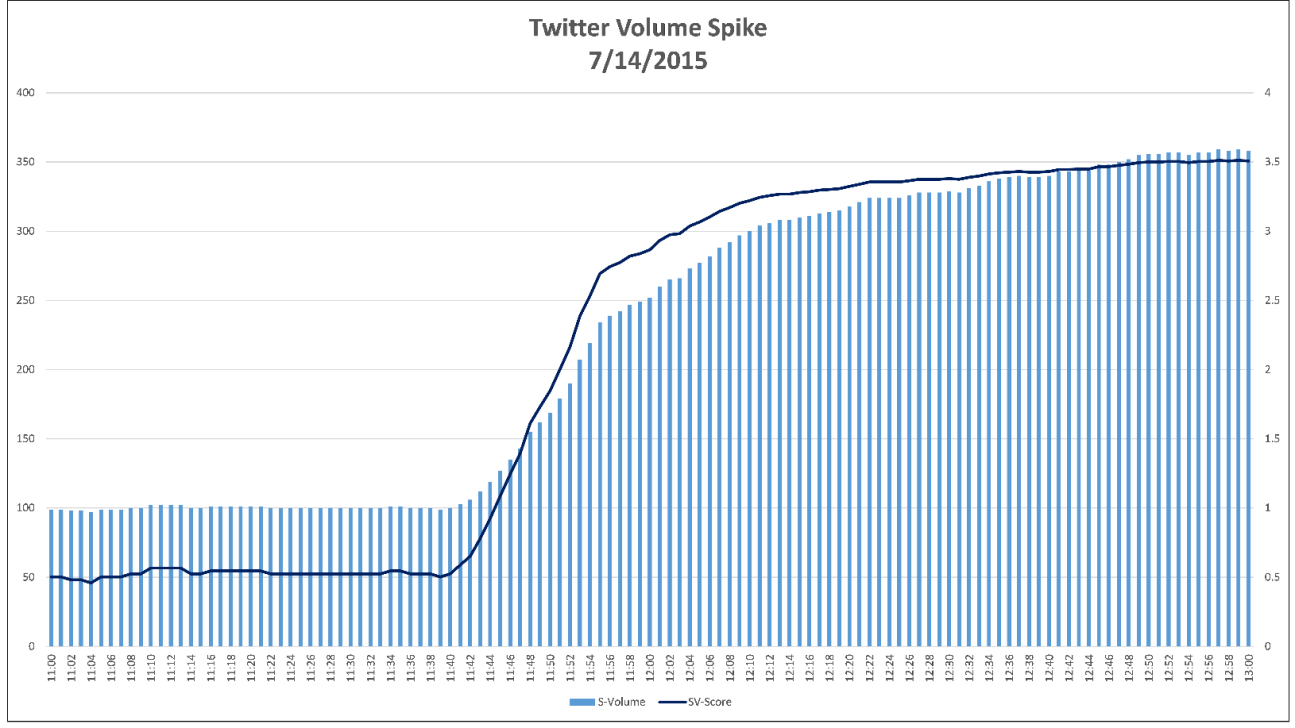
Today I will explore decile groupings based on S-Scores, and  plot cumulative subsequent returns. We typically focus on an S-Score > 2 for subsequent positive movements in stock prices, and an S-Score < -2 for negative movements in stock price.

Our metrics identify when a conversation becomes significantly more positive or negative than normal.  Most stocks have normal conversations on any given day.  On these days there are other factors driving the security. “Normal” conversation securities will typically follow the market, as you see in the SMA data set.  High sentiment out-performs and low sentiment under-performs,  Open to Close, and Close to Close, across Twitter and StockTwits.

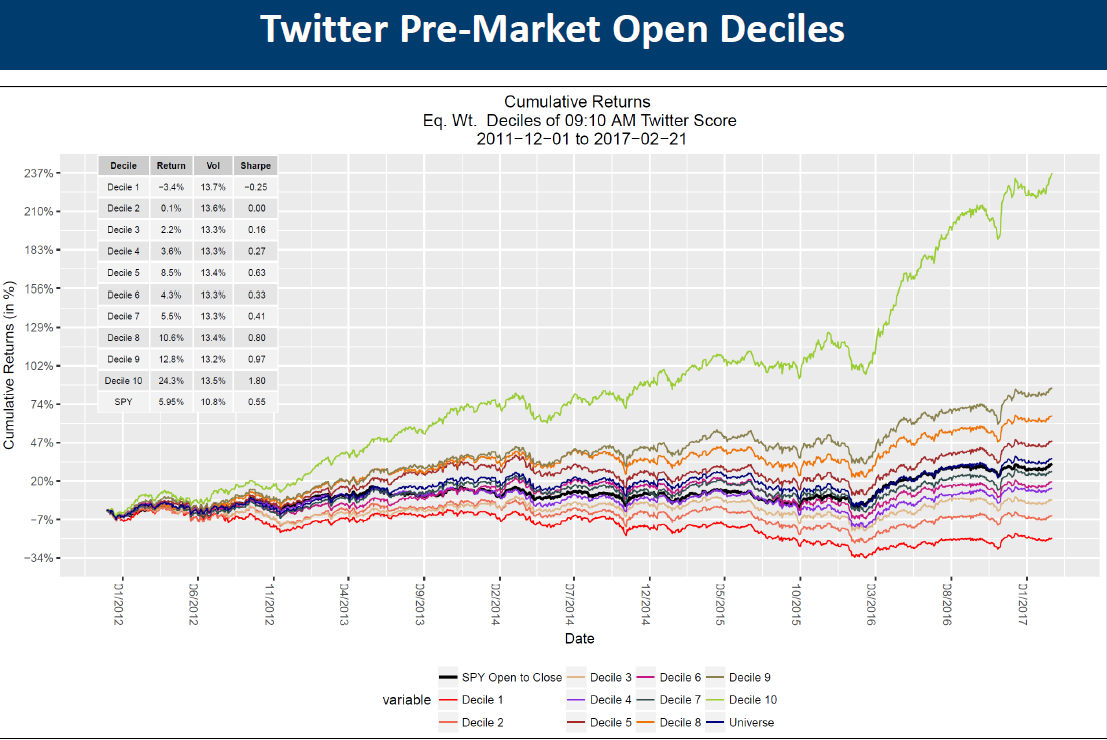
The only filter we add is that the prior day’s closing price must be above $5, to avoid penny stocks.  Total return time series are used for returns, and time series are equal weighted.

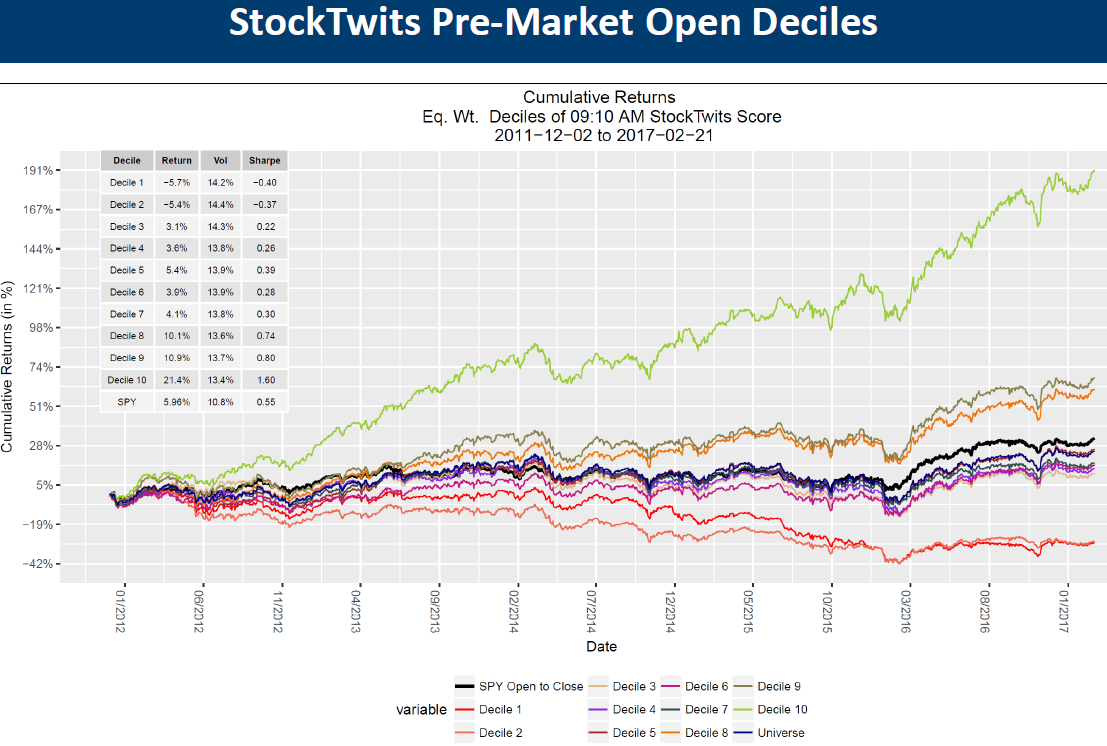
The first chart illustrates subsequent Open to Close returns based on S-Score deciles at 9:10 a.m. Eastern time. As you can see, the deciles are in order with top decile securities out-performing and bottom decile securities under-performing.  SPY is represented by the black line and the universe is blue.

Twitter-Pre-Open

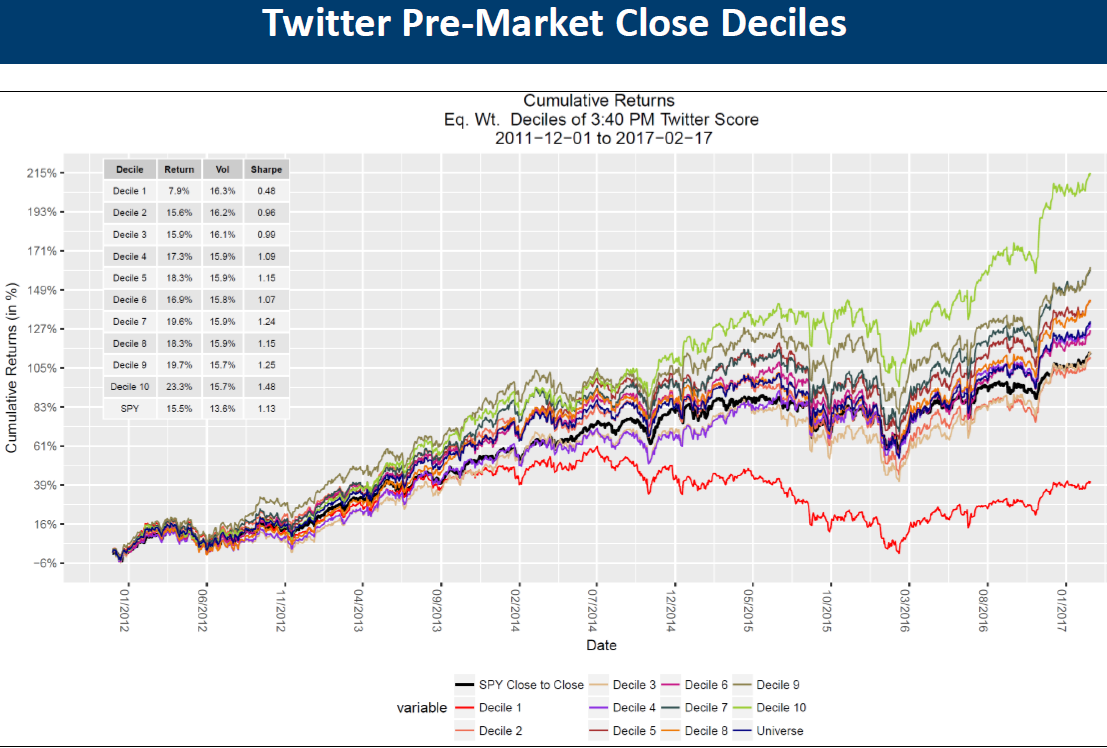
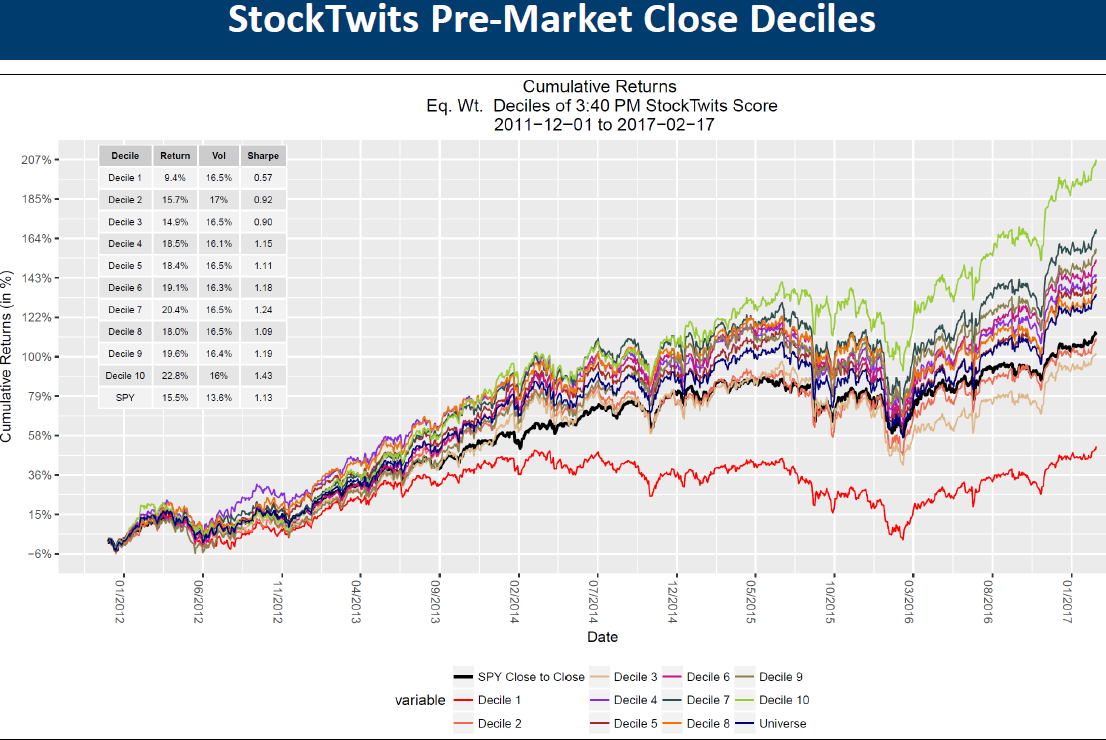
Pre-Market Close deciles are below.  S-Scores are taken at 3:40 p.m. Eastern and Close to Close returns are calculated.  Again, high S-Score securities out-perform and low S-Score securities under-perform, with the universe in the middle.

Twitter-Pre-Close-Close

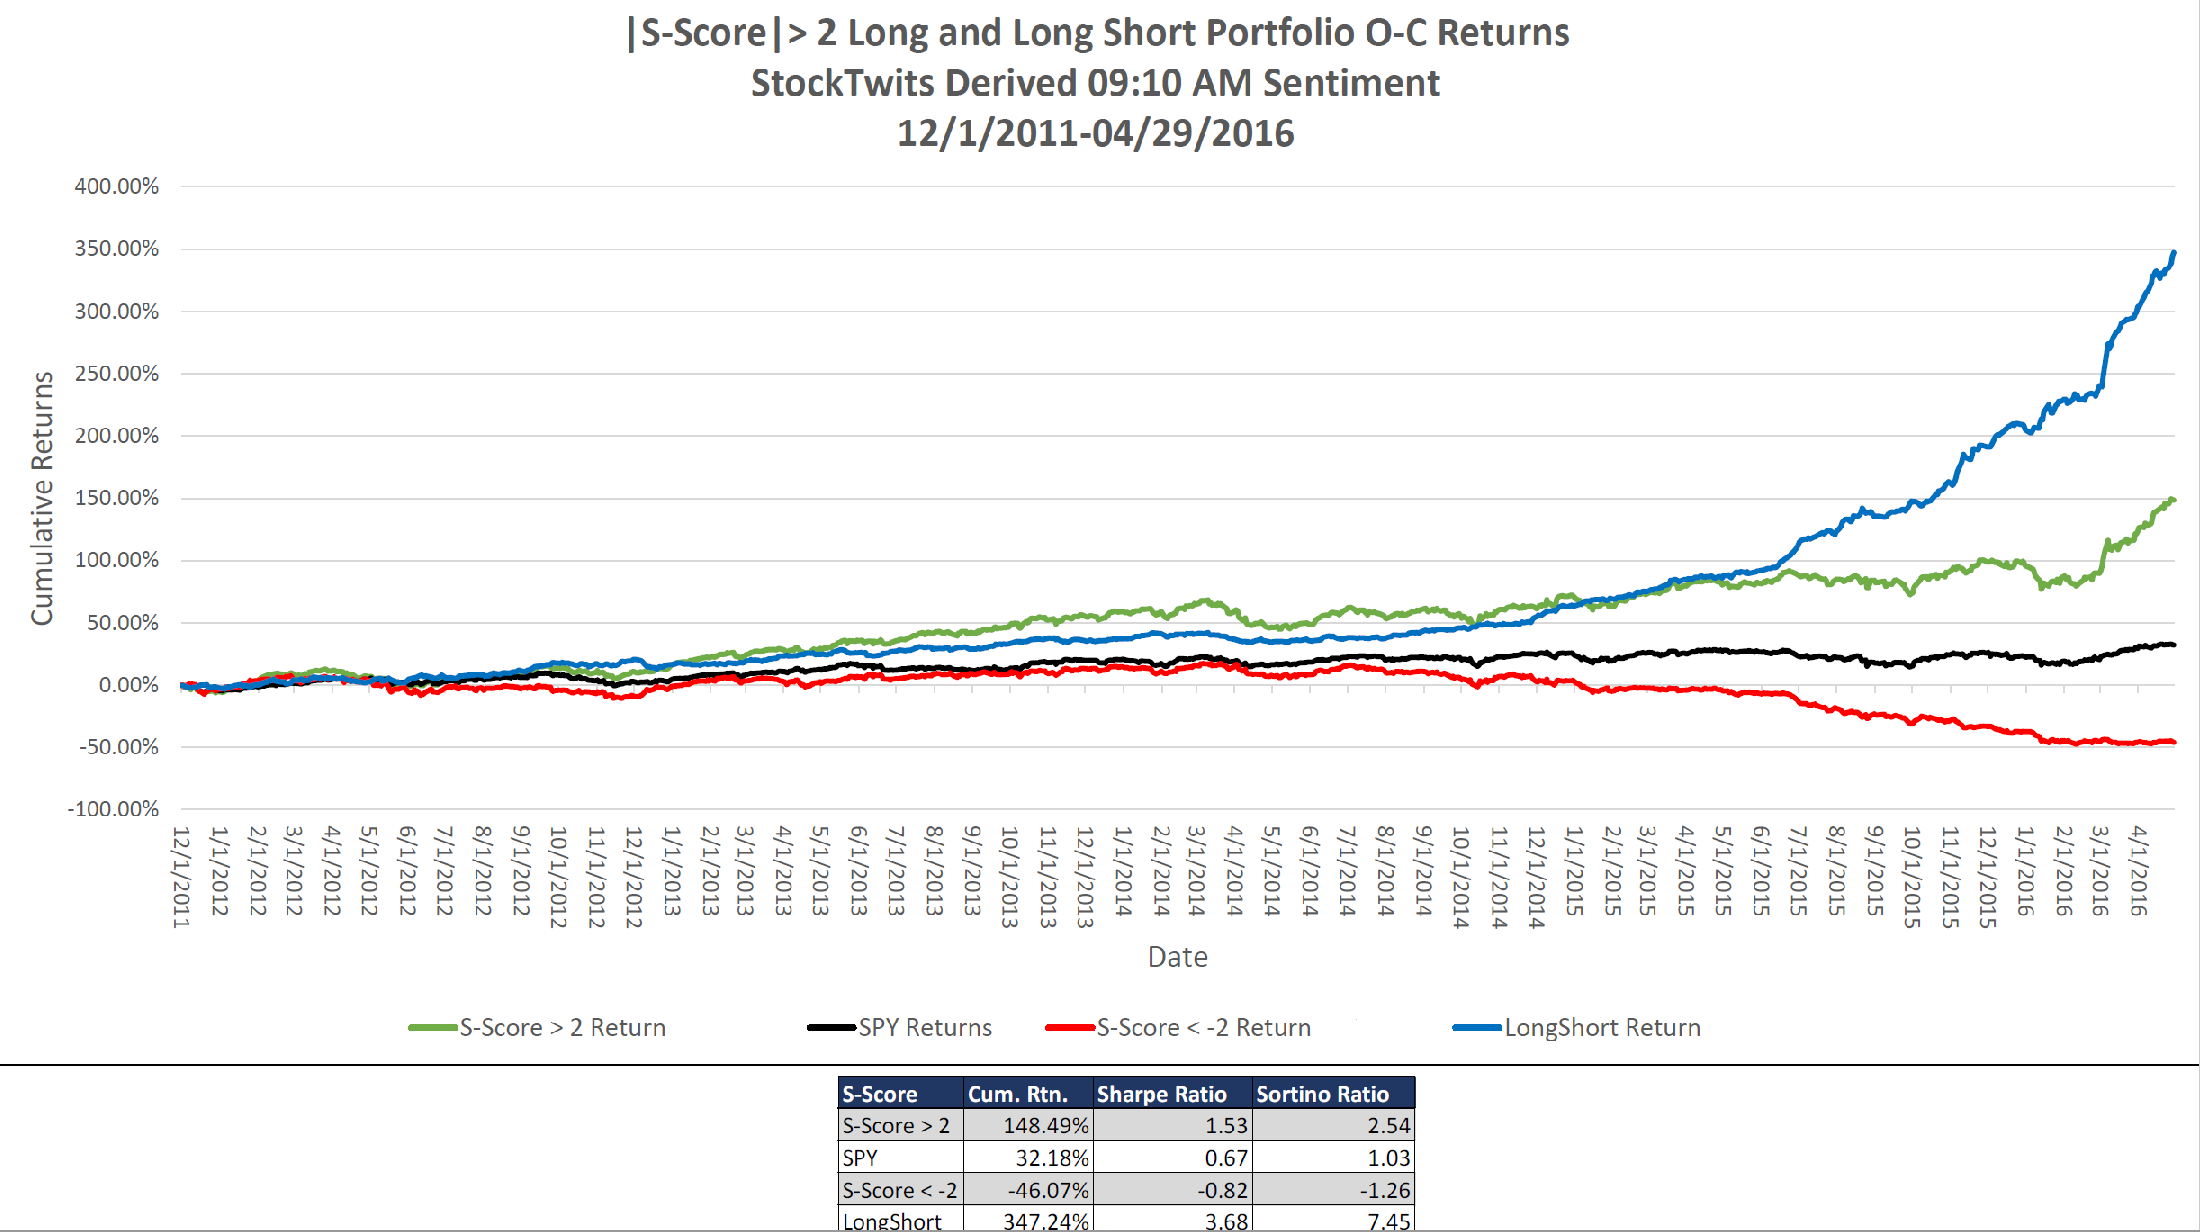
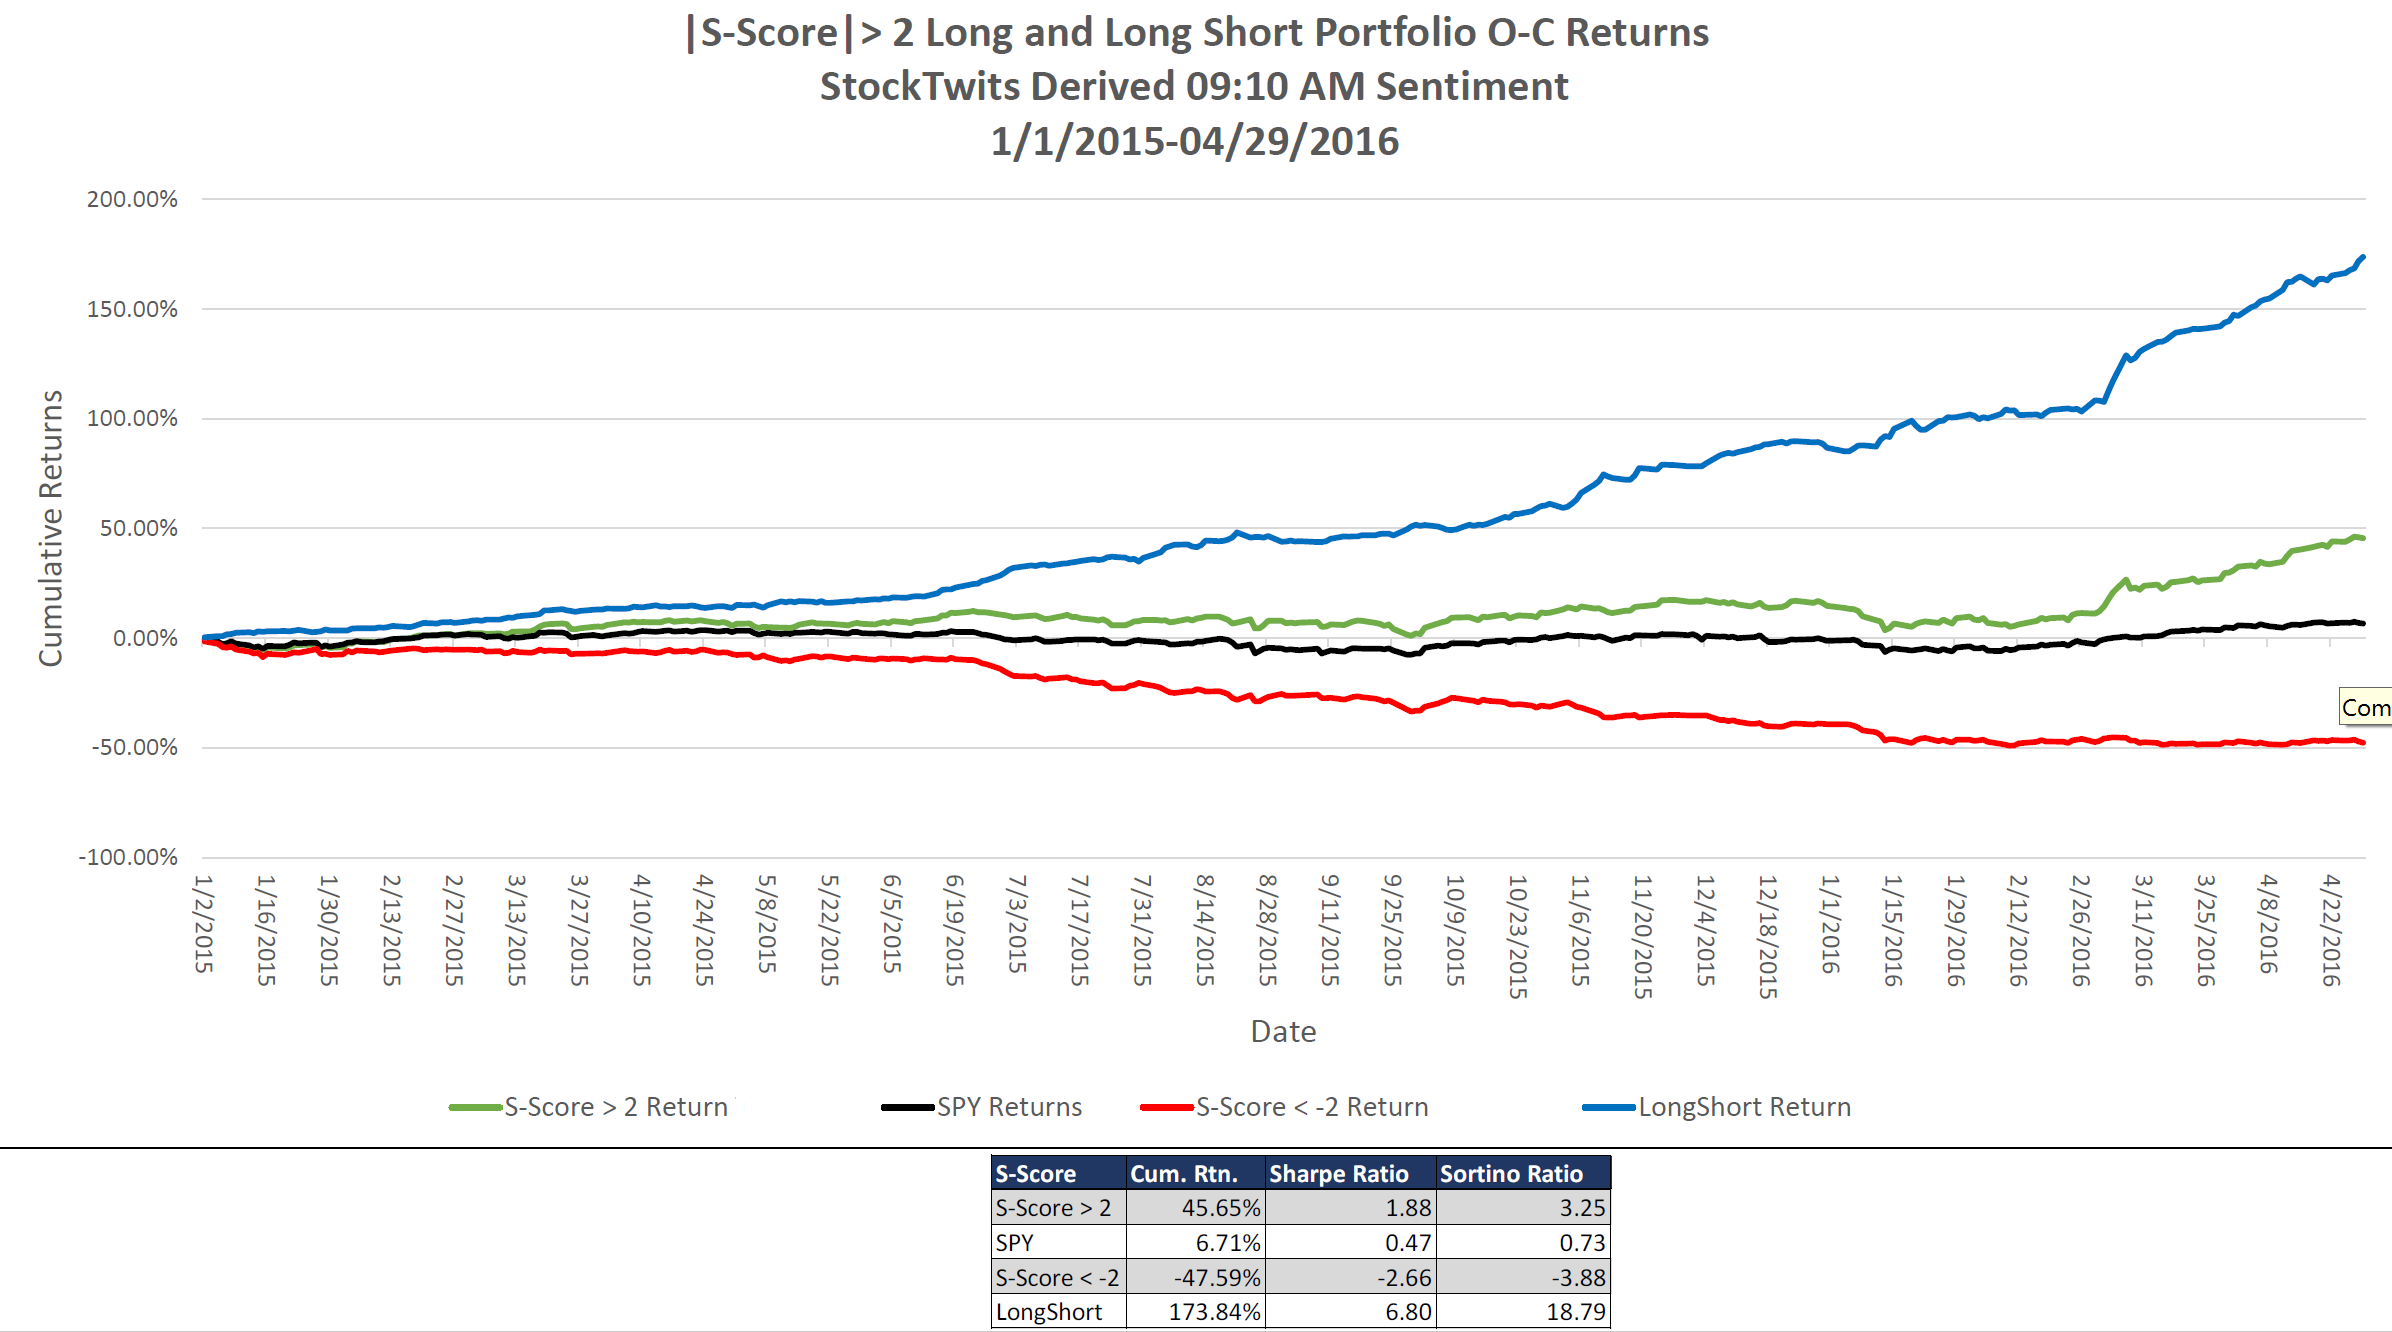
StockTwits is the largest chat community for active traders.  Its users are professional traders discussing long and short positions. The below chart looks at S-Score decile returns based on StockTwits conversations.

Data is consistent across deciles.  A unique characteristic of the StockTwits feed is that there are significant short conversations.  The lowest two deciles have negative returns.  This is a function of the StockTwits community being able to short securities by direct short selling or taking net short options positions.

StockTwits PreOpen

Pre-market close deciles are below.

StockTwits CLose-close

To learn more about Social Market Analytics and the products we offer please visit our website, or contact us here.

Thanks,

Joe

Social media beats the mainstream media on a regular basis.  Last week social media beat the news wire in reporting the MSFT acquisition of LNKD (blog post below) and Tuesday Twitter broke SCTY being acquired by TSLA.  This information is not theoretical – it is actionable data in our feed!

Tesla Motors lit up Twitter, yesterday, when CEO, Elon Musk came out and said their cars can float on water.  Tuesday June 21, the electric car manufacturer took everyone by surprise when they announced their decision to buy the solar panel company SolarCity (SCTY) minutes after the markets closed. The first news article to mention this came out at 4:18 PM CDT. Twitter had already gotten wind of this development 8 minutes prior with a tweet from the account “TopstepTrader”.

TSLA -SCTY

The tweet from “TopstepTrader” was deemed to be credible by Social Market Analytics’ sophisticated algorithm, which separates signal from noise to create actionable intelligence. The sentiment started to move in a positive direction the very next minute. By 16:12 CDT, SMA’s subscribers received ‘S-DeltaTM’ alerts on SCTY. The PredictiveSignalTM from SMA became positive at 16:13 CDT and at 16:18, when the first news article came out, the sentiment had already reached an extremely positive level, with Tweet volume soaring high; as was the stock price. Traders who incorporated social media sentiment from SMA into their trading models were ahead of the curve, making profits as the rest of the market was just learning of the news.

SCTY

The S-Delta metric also flagged this move.  The below chart illustrates the delta values for SCTY.  Delta represents the change in S-Score over a 15 minute lookback.  Delta values of 2 or higher are huge outliers. An SMA alarm based on Delta or S-Score would have provided an alert to this breaking news.

SCTY_Delta

To find out how you can use SMA S-Factors in your investment process contact us at Info@SocialMarketAnalytics.com


Social Market Analytics (SMA) aggregates the intentions of  investors as expressed on the StockTwits platform.   SMA creates proprietary S-Factor metrics that quantitatively describe the current conversation relative to historical benchmarks.  This data provides strong predictors of future price movement.  This blog will focus on the deterministic nature of the StockTwits data set when aggregated into SMA S-Factors.    StockTwits is a community for active traders to share ideas enabling you to tap into the pulse of the market:  http://stocktwits.com/

The charts and tables below illustrate the subsequent open to close return of stocks that are being spoken about abnormally positively or abnormally negatively on StockTwits twenty minutes prior to market open.  Sharpe and Sortino ratios for the theoretical portfolios are included as well.  The SMA S-Score looks at the current conversation relative to historical benchmarks and creates effectively a Z-Score.

The Green line below is an index of subsequent open to close return of stocks with abnormally positive conversations on StockTwits prior to the market open.  The Red line is an index of the subsequent open to close return of stocks with an abnormally negative conversation prior to market open.  The black line represents the market open to close return and the blue line represents a theoretical long/short portfolio.

These charts clearly illustrate the predictive information present in the StockTwits message stream. If there was no predictive power in the StockTwits data set the Green, Red, and Black lines would be nearly identical -statistically not the case.  These signals are available at 9:10 am Eastern time well before the market open.

The chart below looks at the full SMA history of StockTwits based S-Factors.  The theoretical long portfolio has a Sharpe Ratio of 1.53, theoretical short portfolio -.82 Sharpe and LS portfolio has a Sharpe of 3.68.   Sortino Ratios are above one as well.  There is strong predictive power in this data.

FullHistoryStockTwits

The last year has been particularly challenging for the Hedge Fund community.  Below is a chart with the performance of the theoretical portfolios broken out from 1/1/2015 to current.  As you can see these portfolios performed well in this volatile market period.

LastYearStockTwits

For more information on these data sets please contact Pierce Crosby:  (pierce@stocktwits.com)  or Joe Gits: (joeg@socialmarketanalytics.com)

Regards,

Joe

Smart Beta Sentiment Enhanced ETF Performance Analysis

At SMA we continuously research our data.  Below we discuss modifying weights of the SPDR SPY ETF based on sentiment values and examine the impact on return.  Please contact SMA (info@SocialMarketAnalytics.com) to learn more.

The SPDR SPY ETF is a cap-weighted ETF which closely replicates the performance of the S&P 500. Our objective is to develop a “smart beta” strategy using the social media sentiment levels of individuals ETF constituents and amplify or accentuate the weights of the constituents in the ETF while keeping the Assets under Management constant. The transaction cost assumption is ignored for both the original and the enhanced ETF.

One of the strategies explored was looking at the sentiment levels an hour before the close (2:55 PM Eastern Time) and re-balancing the weights according to that. The stocks were bought or sold (to reduce position as per new weight only, NO short selling) at the close of the day and the positions were maintained until the next day when the re-balancing was performed again. To explore the weight modification methodology please contact SMA.

Our re-balance strategy keeps the AUM constant with no need for additional funds. Another strategy explored was to use a “lagged” sentiment. The lag being a day. So, for adjusting the weights today, we looked at the sentiment at 2:55 PM yesterday, and changed the positions based on that.

The results for the cumulative returns calculated over the period extending 7/31/2013-8/31/2015 are summarized below.  Chart 1 shows the cumulative returns over the period for the “Original” which calculates fund returns using positions and closing price data. The “500% PM” makes the calculations using enhanced weights based on the pre-close sentiment. The “500% PM Lagged” has enhanced performance using pre-close sentiment from previous (trading) day.

Chart 2 shows the cumulative out performance, for the 2 “smart beta” strategies.  As you can see both strategies track the SPDR SPY ETF while outperforming performance.  You see the benefit of adding sentiment to your calculation process without increasing risk.

Chart1

Chart2

This is preliminary research we will be enhancing and updating over the coming weeks.

Regards,

SMA

Social media is a new and rich source of trading ideas.  To illustrate this point, below are some recent  trading opportunities social media data presented.  In each case activity and sentiment increase prior to the actual event.  Social media is a leading indicator of stock performance and SMA is the leader in providing metrics based on social media.

Teva acquires Allergen

Teva Pharmaceutical Industries surged in pre-market trading on July 27, 2015 on news that the company will be acquiring Allergan’s (AGN) generic drug business. Before this happened, sentiment on Twitter had already become strongly positive. At 4:00 AM EDT, when the stock price was $66.00 there was significant positive sentiment on Twitter. The sentiment rapidly shifted positive. By 7:24 a.m., the stock was trading at $72.30. The stock opened at $67.80 when the sentiment was 3.92 and closed at $72.

Figure 1:  S-Score™ For TEVA Pre- and Post-Announcement.

TevaSentiment

TevaHistoricalSentiment

Historically, daily sentiment scores for TEVA fluctuated near 0 (Neutral), with low social media activity as indicated by the time series of the S-Volume™ metric.  This behavior started to change on July 26 with significant upticks in indicative Tweet volumes and sentiment levels.  On the morning of July 27th,TEVA’s S-Score™ increased sharply to a high positve level, coincident with a spike in S-Volume™ consistent with high social media activity, indicating that SMA’s processing technology had sucessfully detected the signature of positve sentiment for TEVA embedded in the Twitter data stream.  This high positive sentiment level persisted through the open on July 28th and then started to return to typical historical levels as the markets and social media fully integrated the effect of the announcement.

Rumored Announcement of Acquisition:  Twitter (TWTR)

On July 14, 2015 at 11:39 AM EDT, a rumor started spreading on Twitter about Twitter being acquired by Bloomberg.  At 11:40 AM, there was a Tweet from user ‘beckyhiu’ indicating that Bloomberg had offered $31 Billion to buy Twitter and that Twitter was considering the offer. This rumor caused the stock price to rise rapidly. A Tweet, about 30 seconds later, at 11.41 AM,  by ‘zerosum24’ confirmed that the rumor had reached Twitter and people had started talking about it. The sentiment had started rising rapidly by this time. The changes in S-ScoreTM and S-DeltaTM were significantly positive. At 11:42 AM, the sentiment was over 2, and was statistically significant.

It was soon realized this might be a hoax and that no offer was made. At 11:42 AM, ‘TurboResearch’ questioned the credibility of the buyout offer.

There had been no official statement from Bloomberg, and hence, both the sentiment and the stock price kept rising. At around 11:50 AM, a journalist from Bloomberg Tweeted that the news was a hoax and that it was not to be believed. At this point sentiment started declining as people starting tweeting negatively. The stock price dropped rapidly.  After that, there were mostly negative comments driven by the refuted rumor.  The figures below show SMA sentiment factors leading the stock price quite accurately.

TWTRSentimentPrice

Figure 2: TWTR S-ScoreTM vs. Price

TwitterVolumeSpike

Figure 3:  Intraday   S-Volume™ Chart for TWTR

Amazon (AMZN) Earnings Announcement 

Twitter sentiment can predict stock changes even after market close, as in the case of Amazon. Amazon reported earnings on July 23, 2015. While the market consensus was that the company would not beat expectations, the conversation on social media was different.

SMA data showed a sharp increase in sentiment metrics around 2:49 PM EDT. By 2:51 PM, the sentiment on Amazon was two standard deviations higher than its typical level. The stock was trading at $480.45 at this point. At market close, it traded at $482.18, higher than the price at the time when sentiment on Amazon became positive.

It was interesting to see how the stock traded after-hours once the company reported earnings. Amazon’s stock shot up more than 17% — to $568 — from its price at 3:51 PM EDT after the company reported a surprise quarterly profit. The hidden sentiment value in Twitter data predicted what “conventional” market speculators failed to predict.

AmazonTweets

AmazonEarnings

Figure 4:  Intraday S-Score™ And S-Volume™ Behavior across Amazon’s Earnings Event.

The progression of intraday S-Score™ and S-Volume™ metrics for Amazon is shown above from 1:00 PM EDT to 4:25 PM EDT.  Amazon’s sentiment remained positive throughout the day and became significant around 2:50 PM. The sentiment saw a sharp rise post the earnings announcement after market close.

We publish our own research and analysis.  We invite you to check our Research site for new updates and publications.

Thanks,

Joe