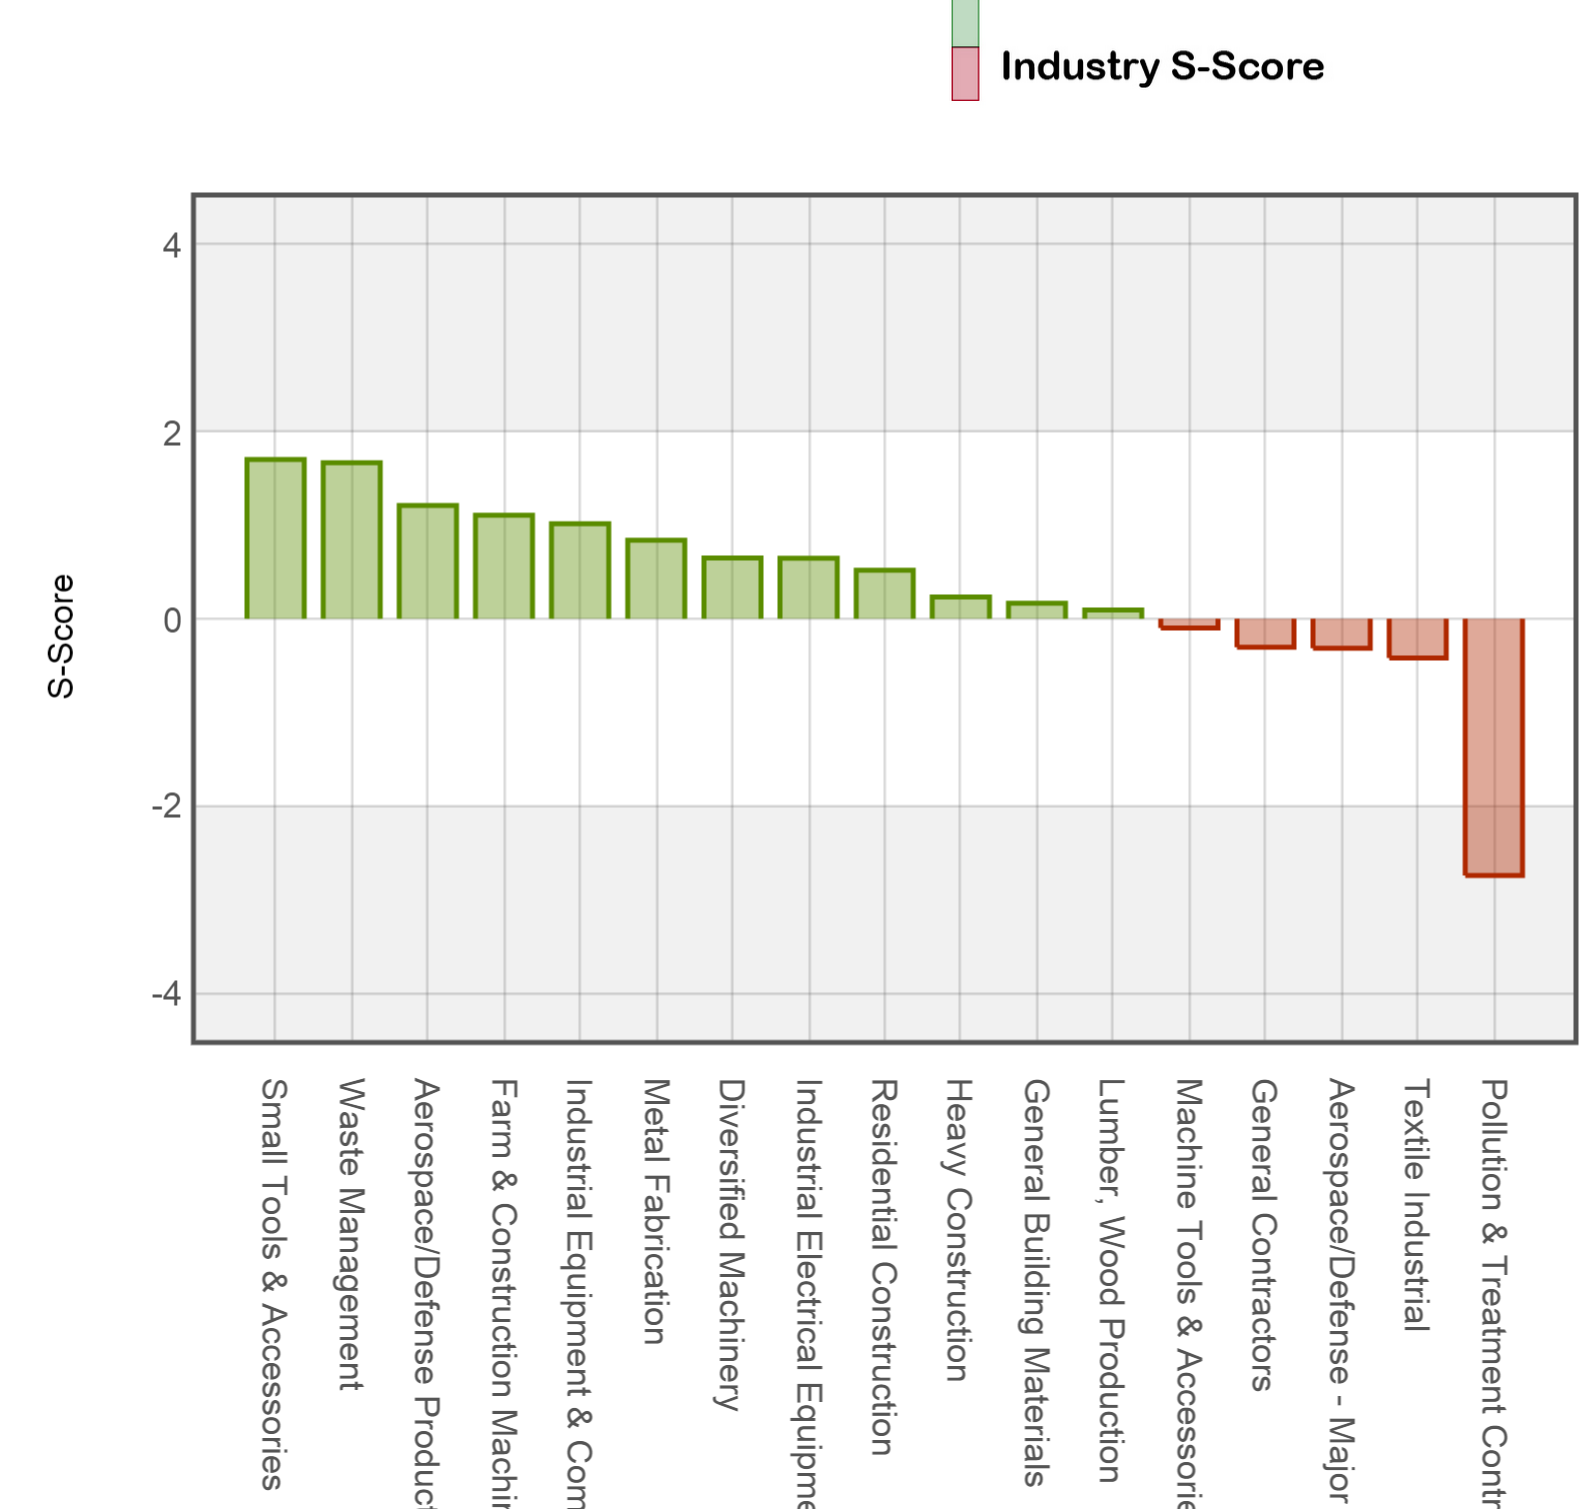
Posts

The target of this research was to find an indicator that helps predict the direction of the overall US Equity market for the next week using sentiment data from the previous week. The hypothesis is when there is high volatility in sentiment over the previous week, which means investors have differing opinions, the subsequent week overall market performance will underperform. When volatility on sentiment is low or neutral, the crowd has reached a consensus and the general market will outperform over the next week. The sentiment metric used to represent volatility is Raw-Volatility in SMA’s S-Factor data feed, which captures the volatility of the sentiment from Twitter conversations. All Raw-Volatility data points were taken from the 3:40 pm ET timestamp (20 minutes before the market close). We calculated the summation of Raw-Volatility for each date as a proxy to represent the volatility of Twitter social sentiment on the entire market. The exact calculation is as follows, where “N” is the number of companies with sentiment on that date and “D” is the date:

We then created a 7-day standardized volatility using a 91-day benchmark:

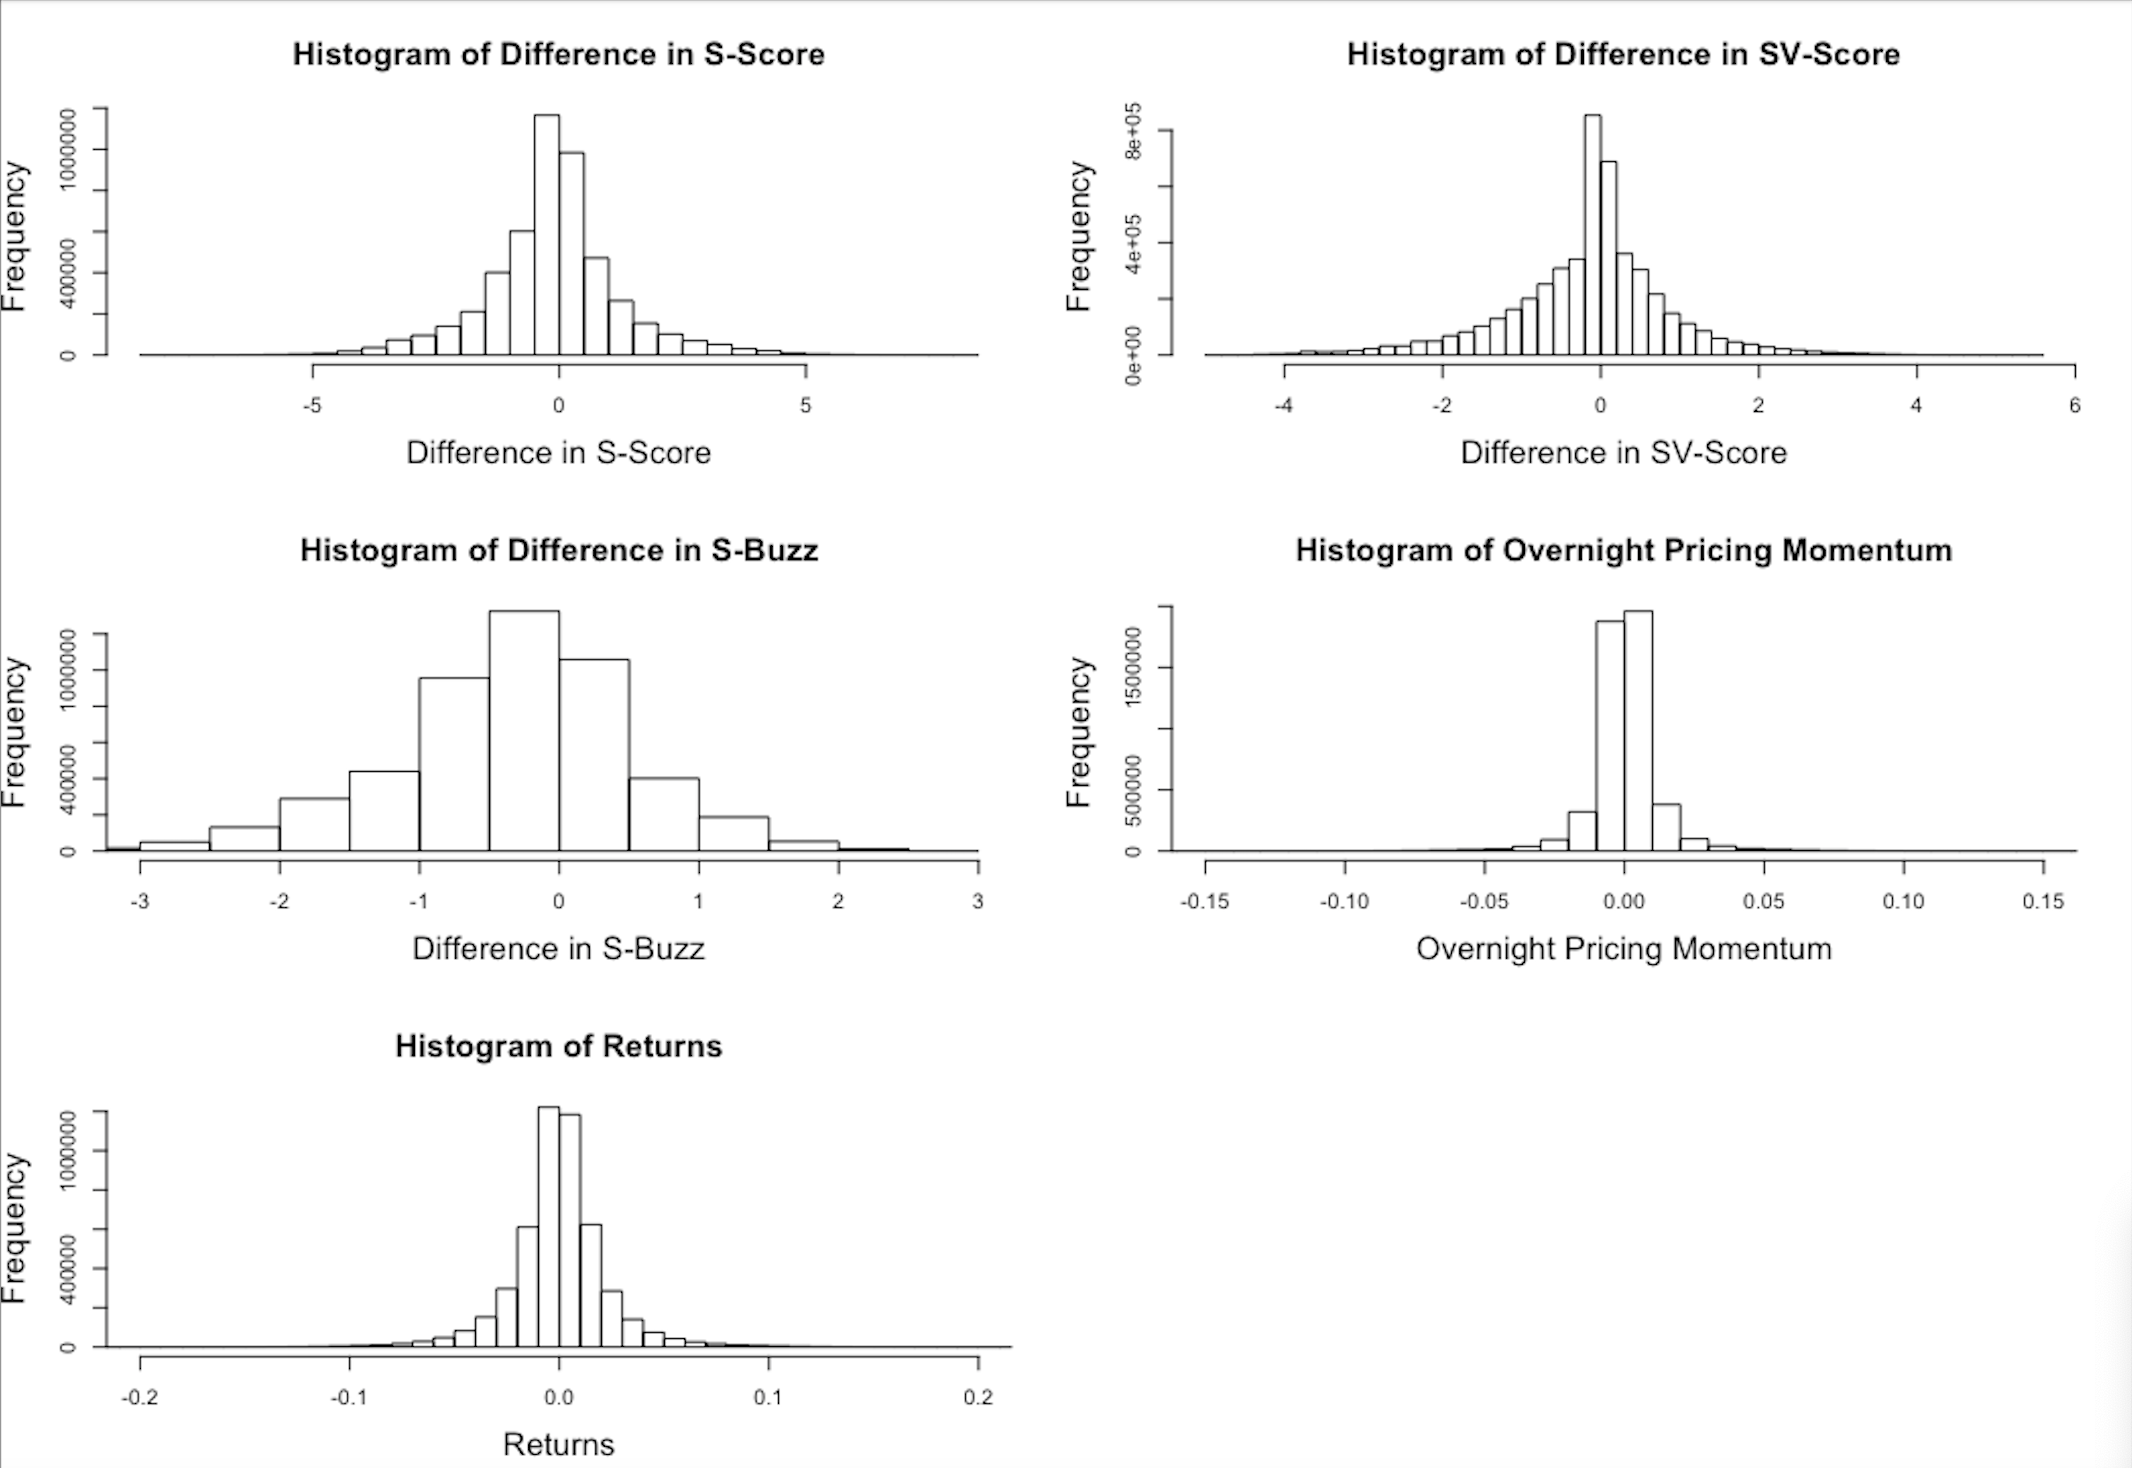
This Z_Volatility score follows a roughly normal distribution.

Using the S&P 500 ETF Trust (SPY) as a proxy of general market performance, we then look at the relationship between Z_Volatility and SPY’s return series. The daily close-to-close return is calculated as:

Hypothesis: When Z_Volatility for the previous closing Date is high, the subsequent market performance will be lower. When Z_Volatility is low or neutral, the next day’s market performance will be higher.

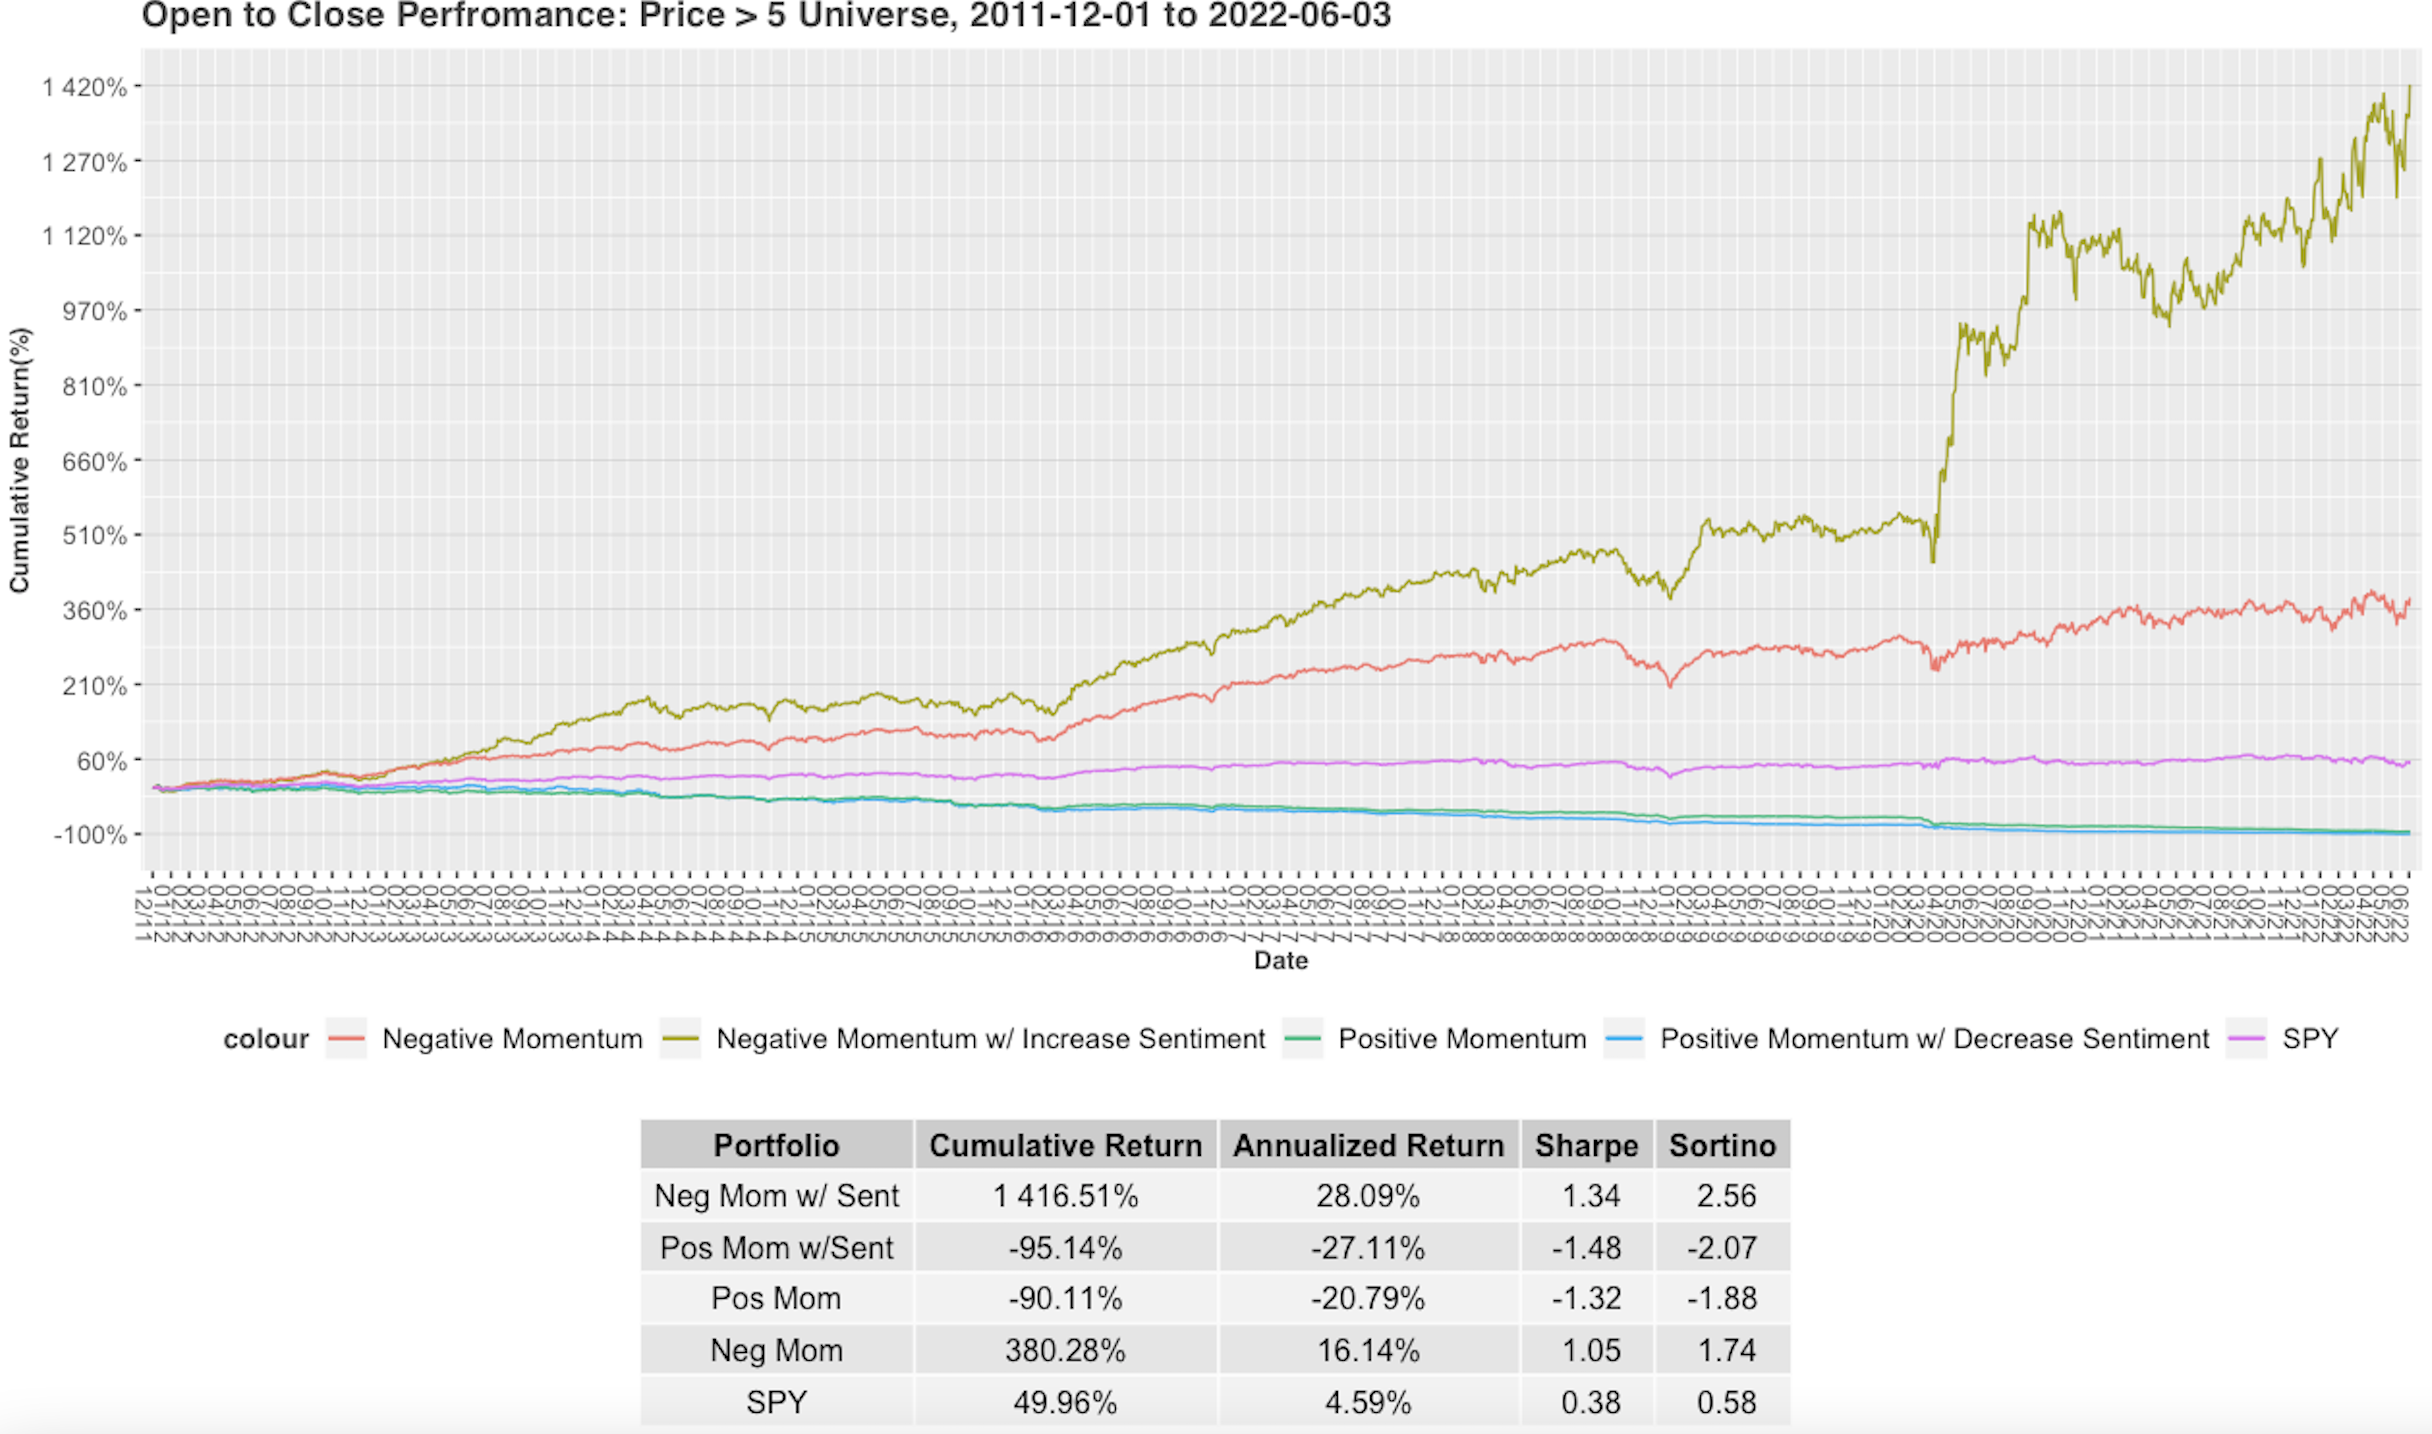
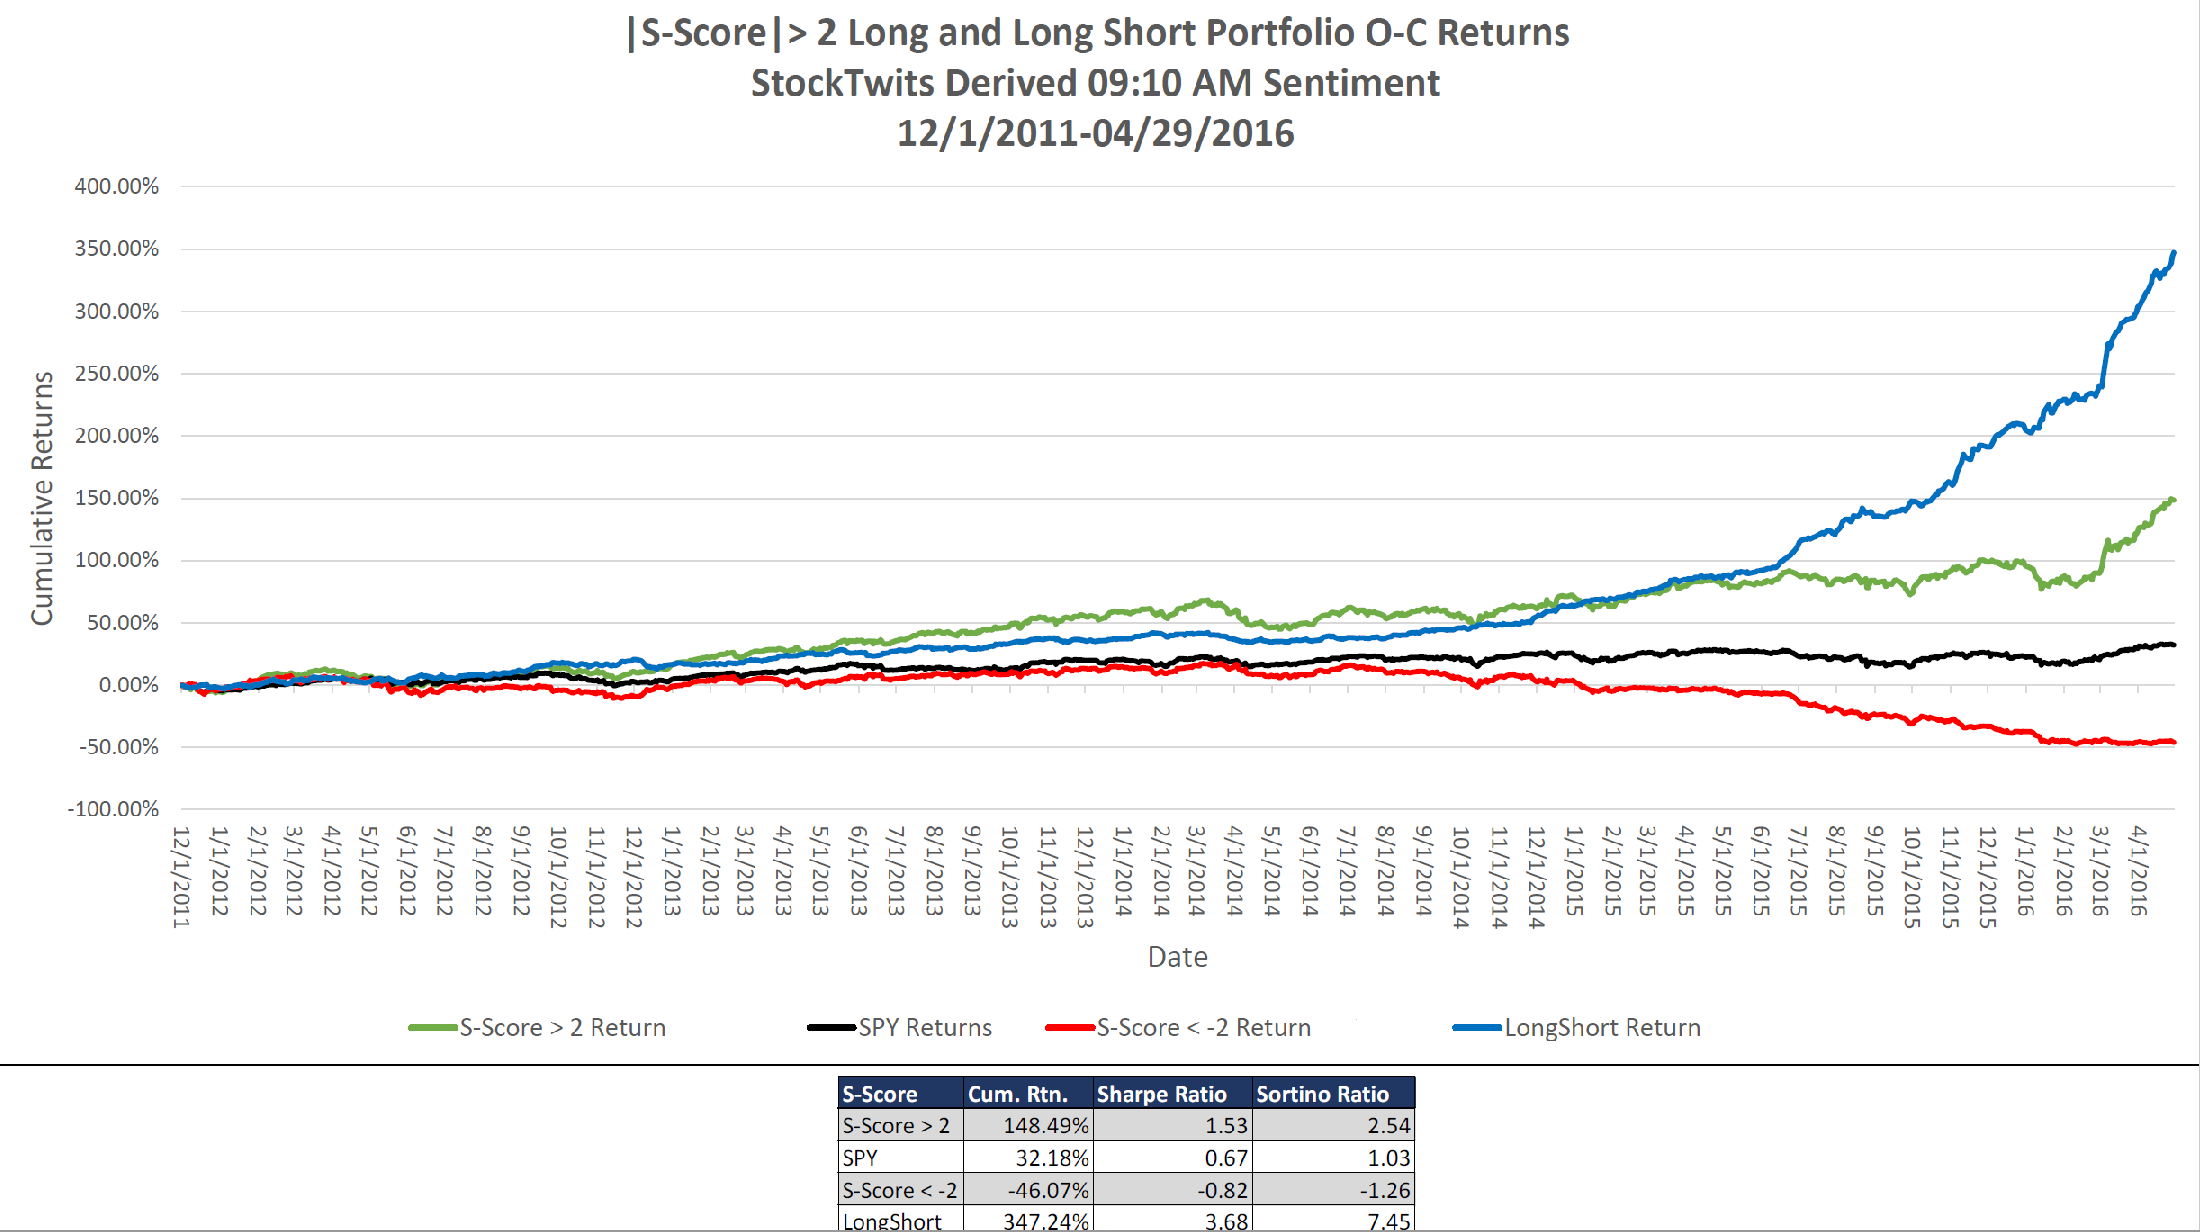
To test this, our strategy is to open short position of SPY when Z_Volatility > 1. When Z_Volatiltiy is =< 1, the portfolio treats SPY as a long position. This hypothetical portfolio is then compared to SPY over the past 10 years:

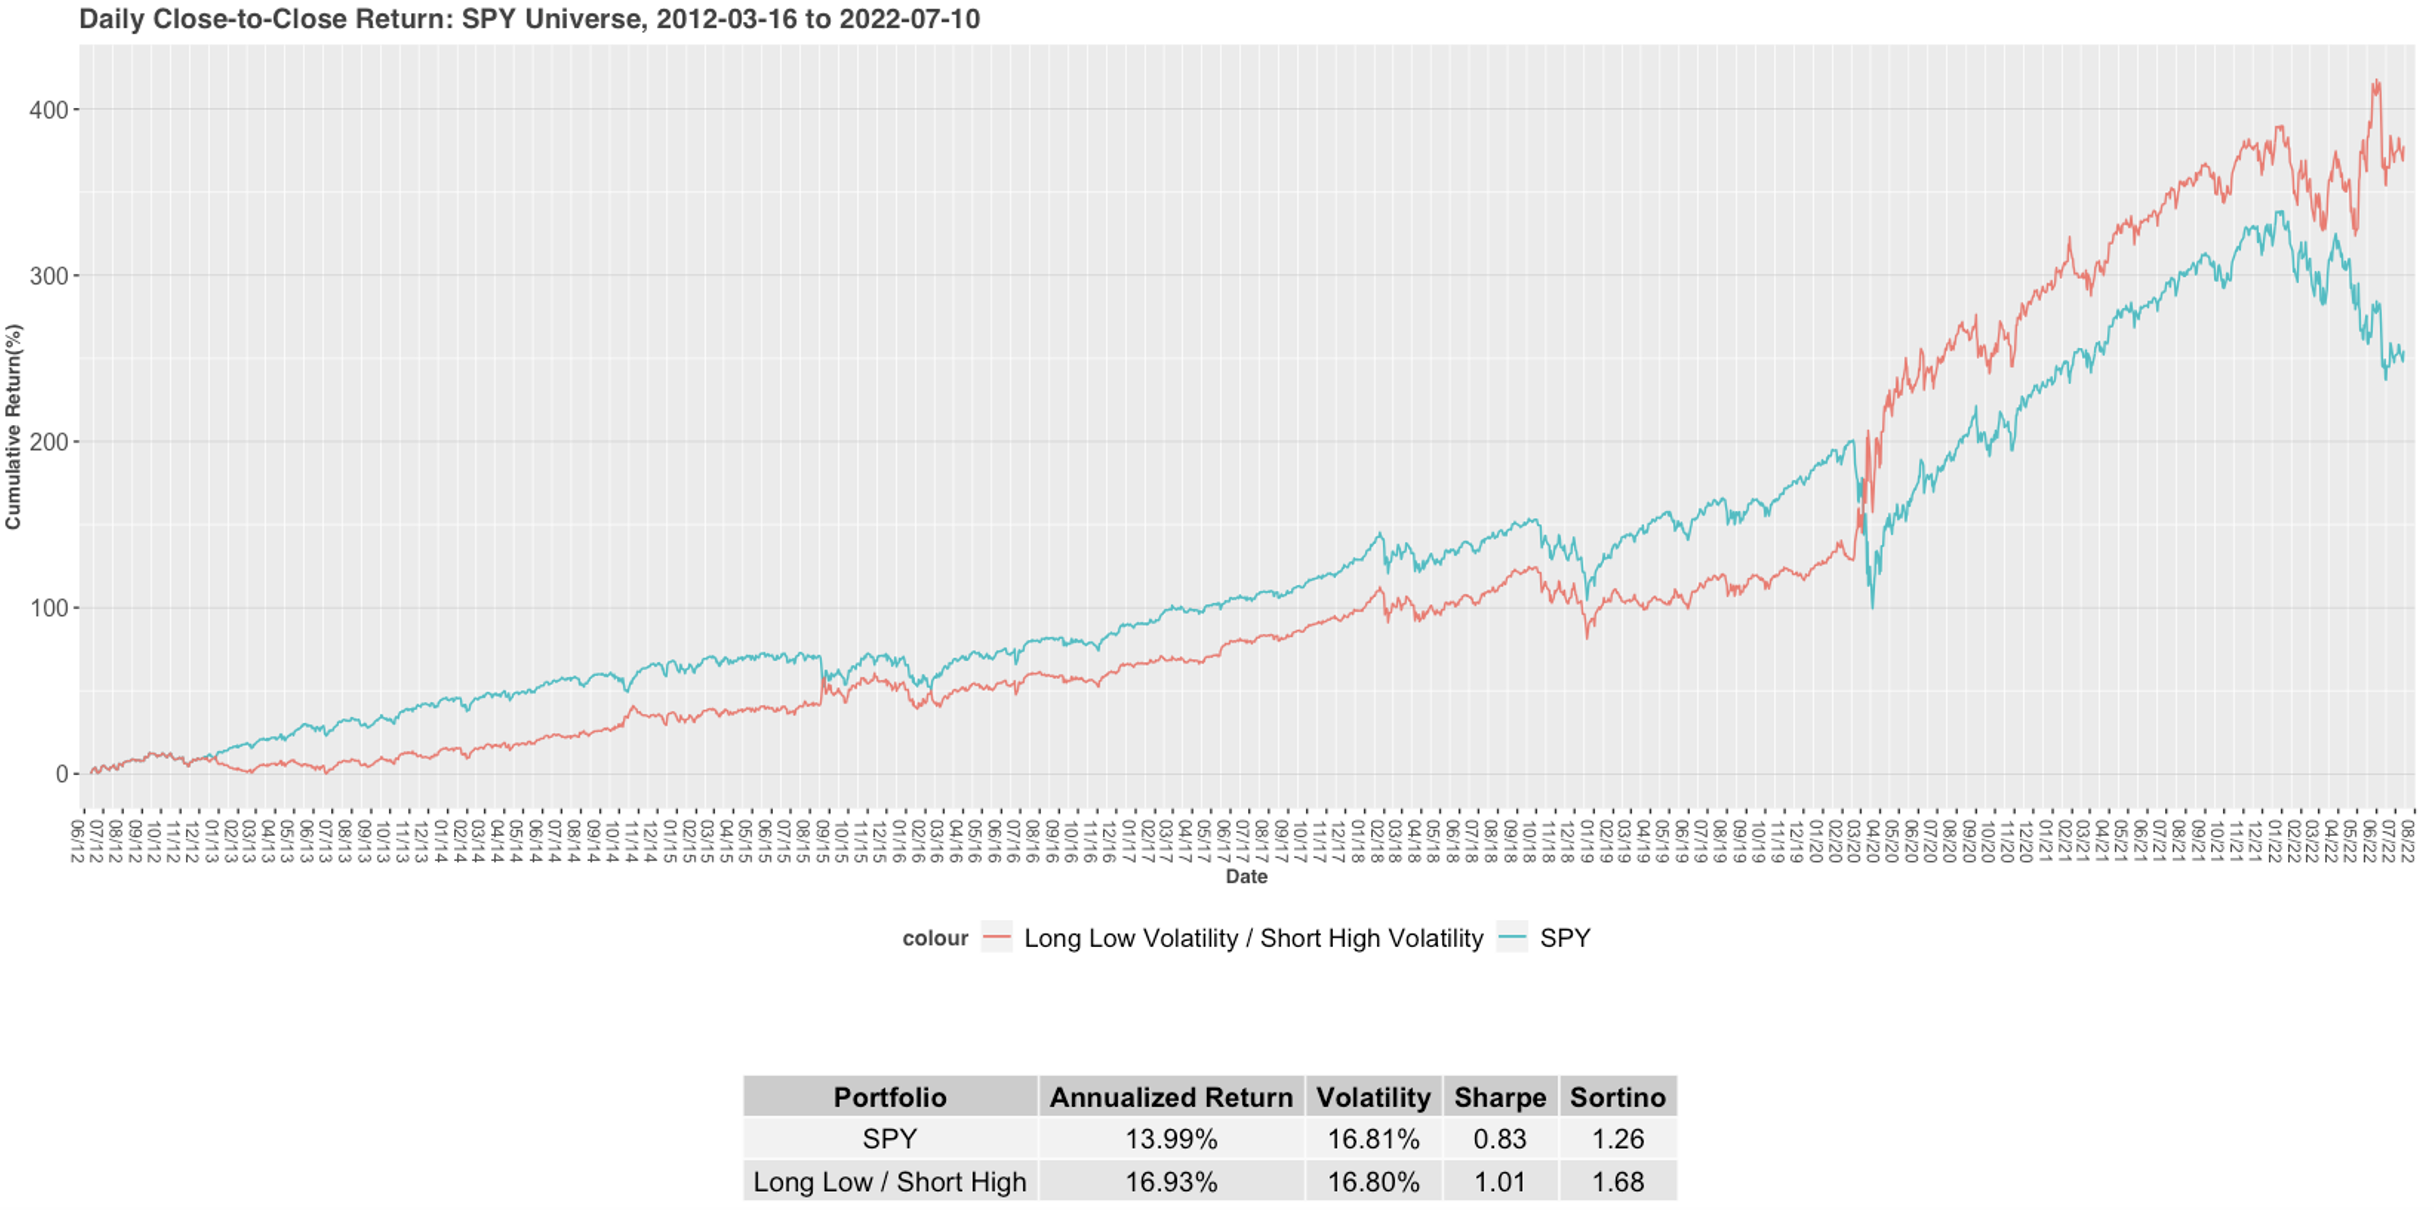
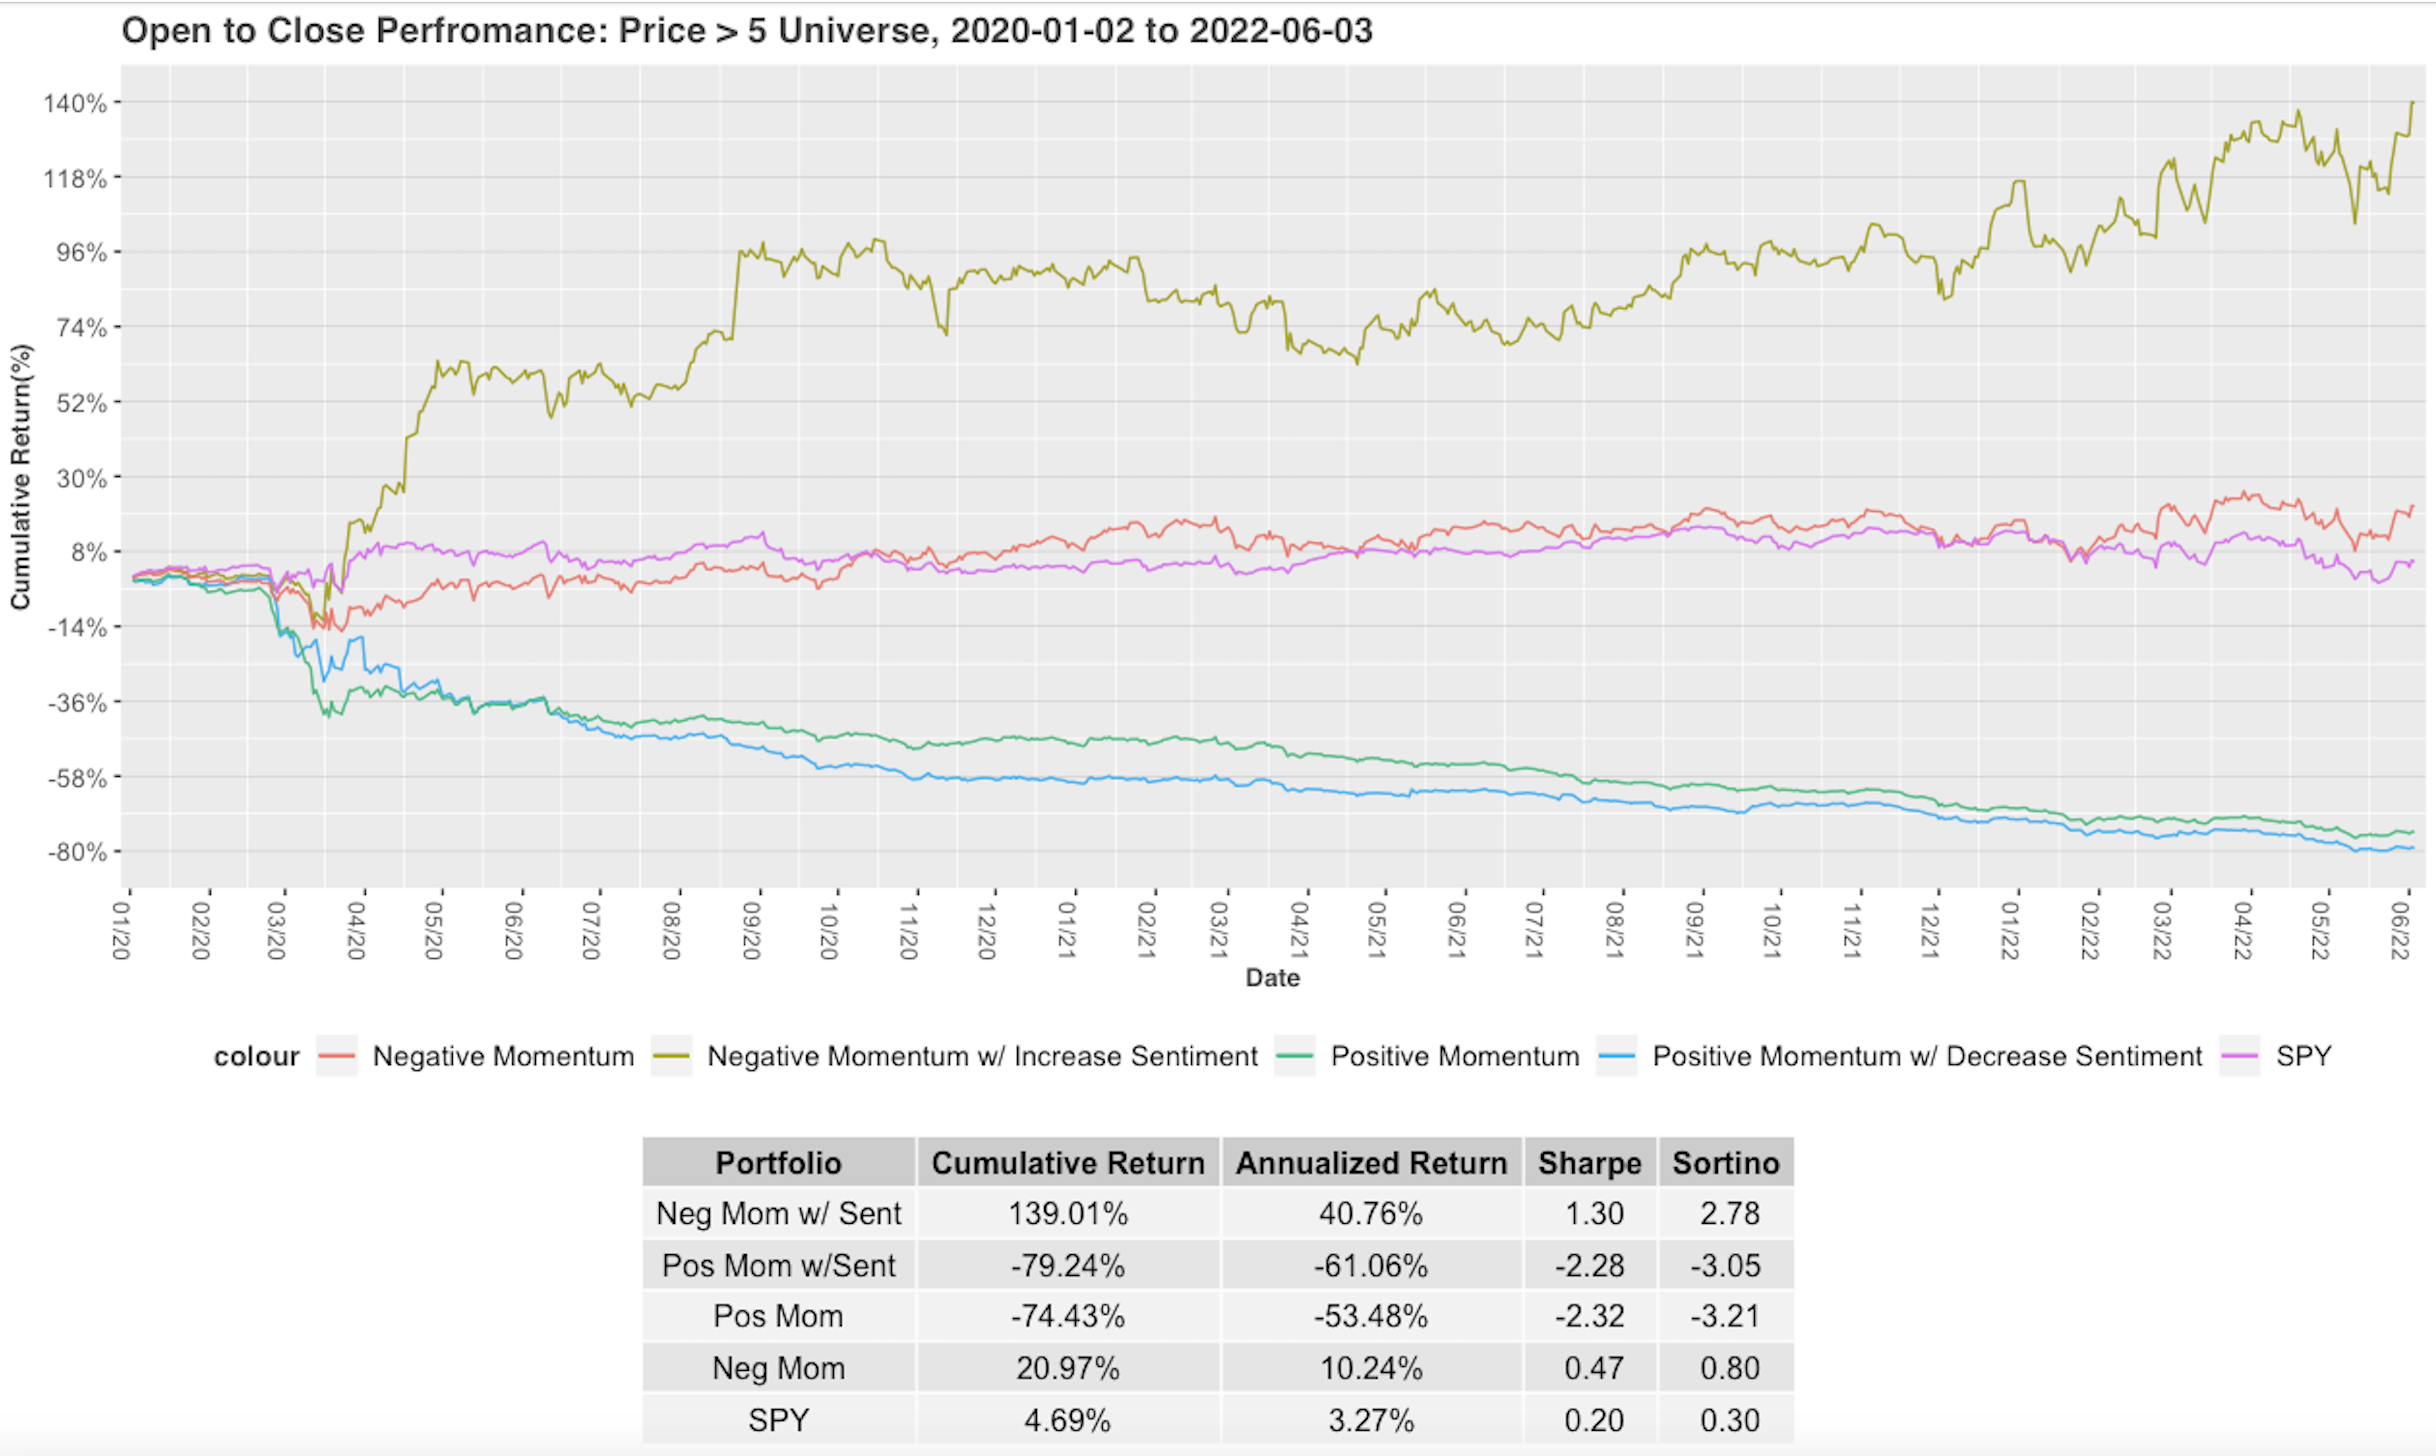
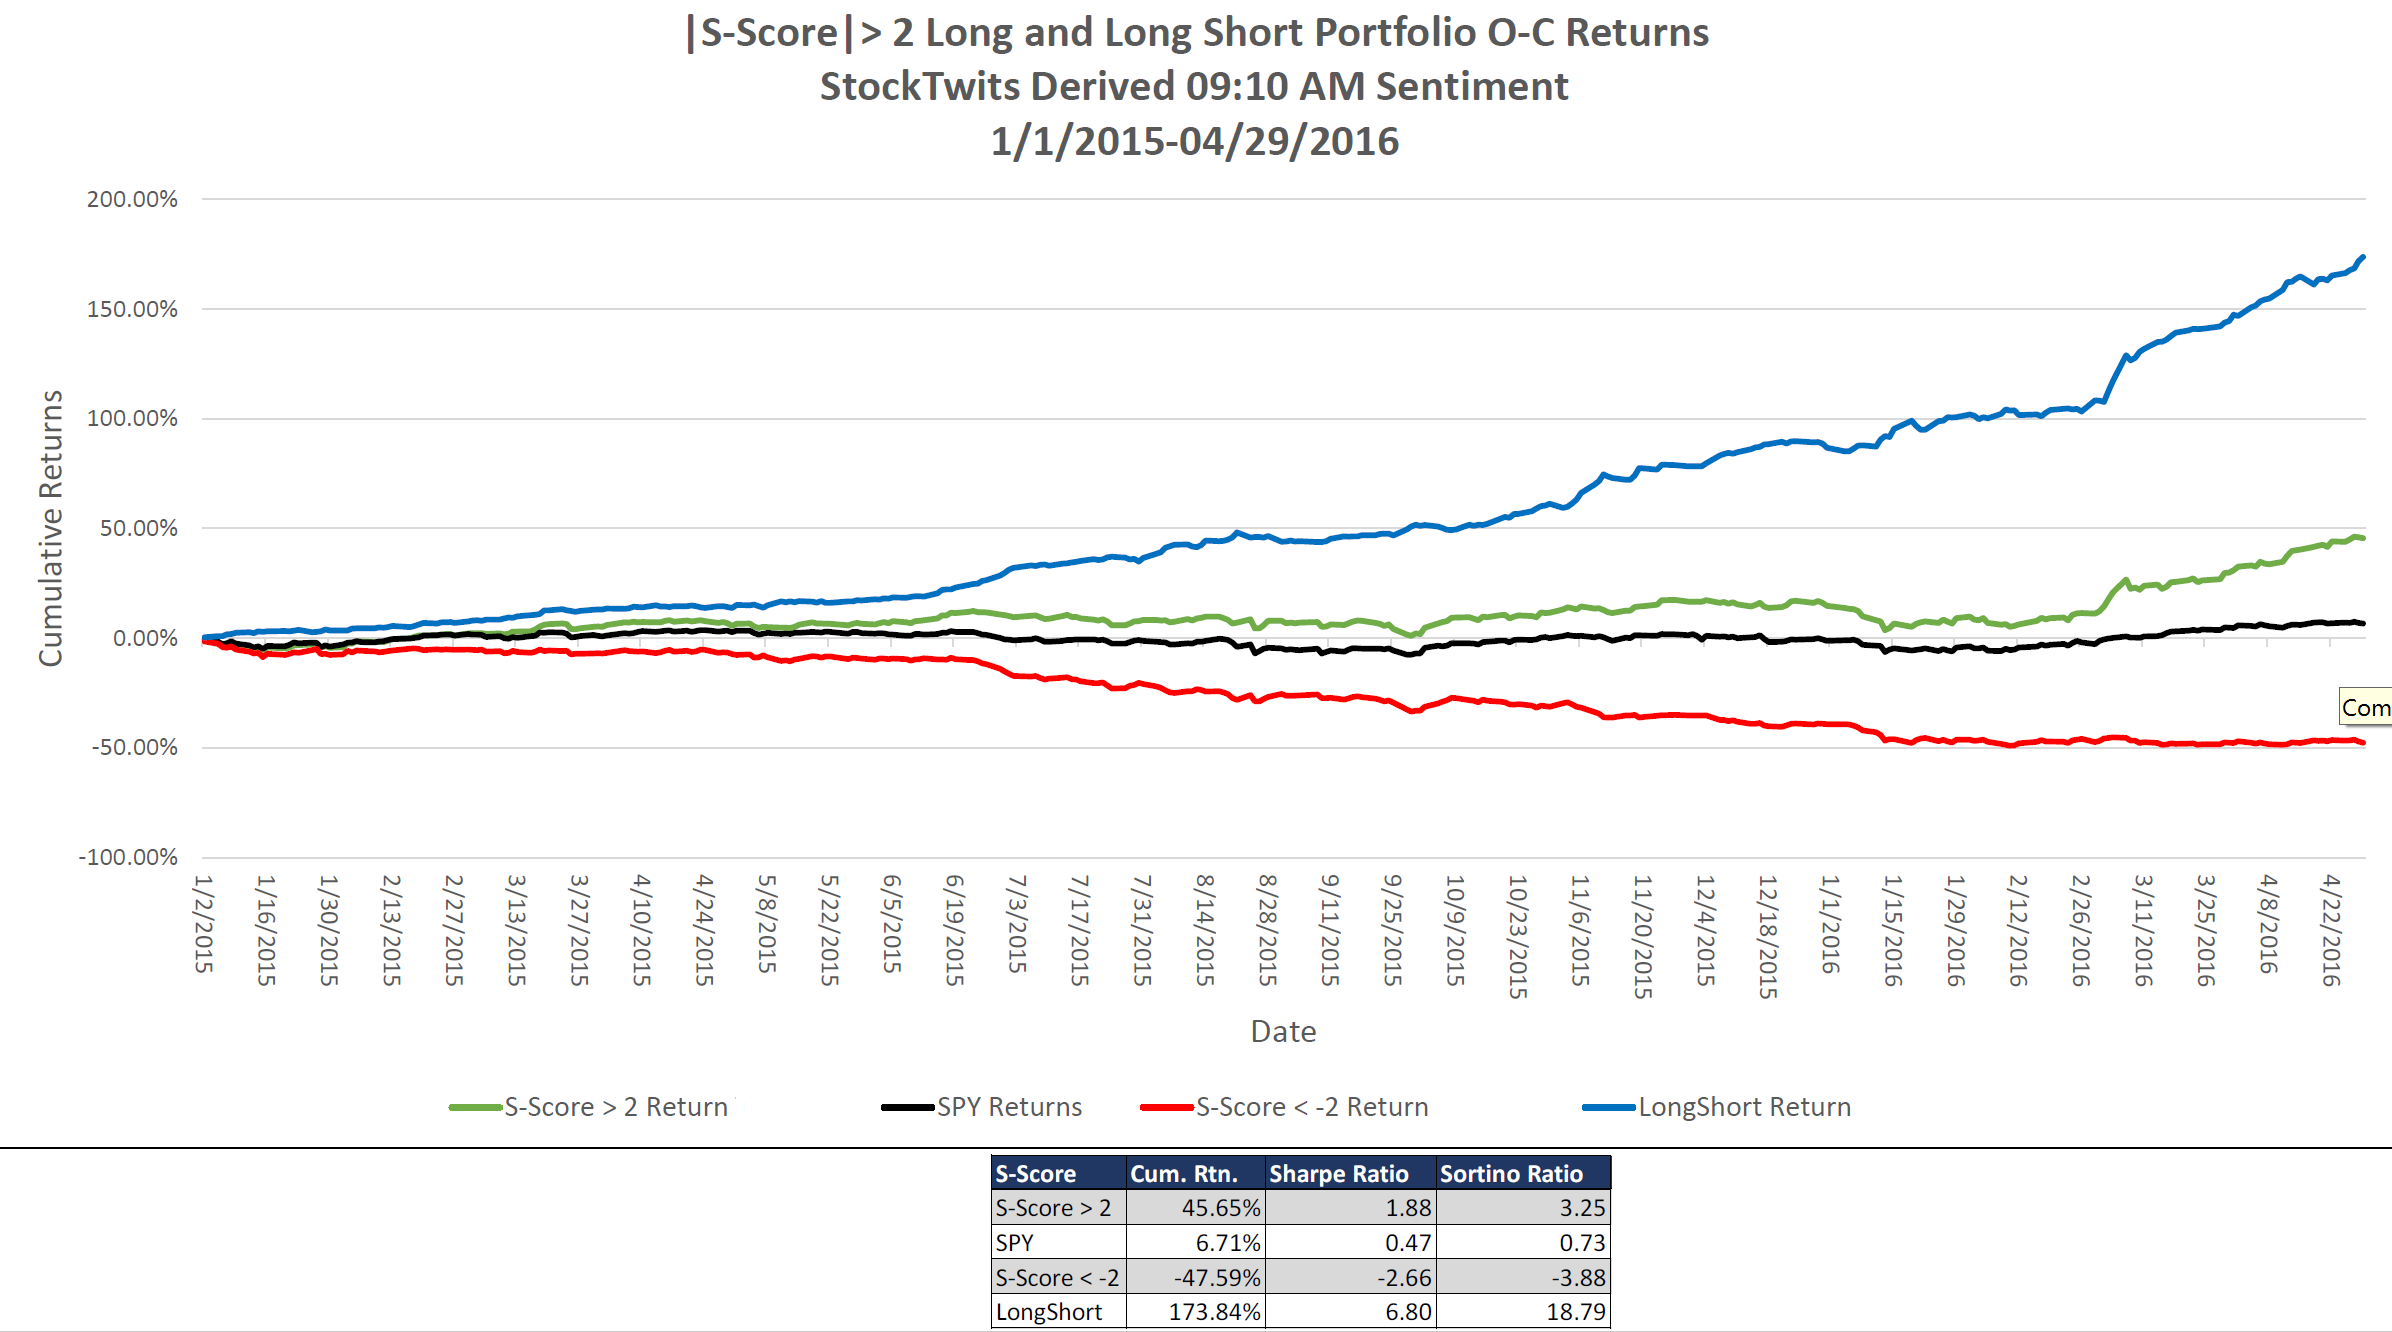
Prior to the COVID-19 pandemic, which began in early 2020, SPY outperformed the modified portfolio. However, since then the behavior of this factor changed drastically. Here is the same graph as above starting in 2020:

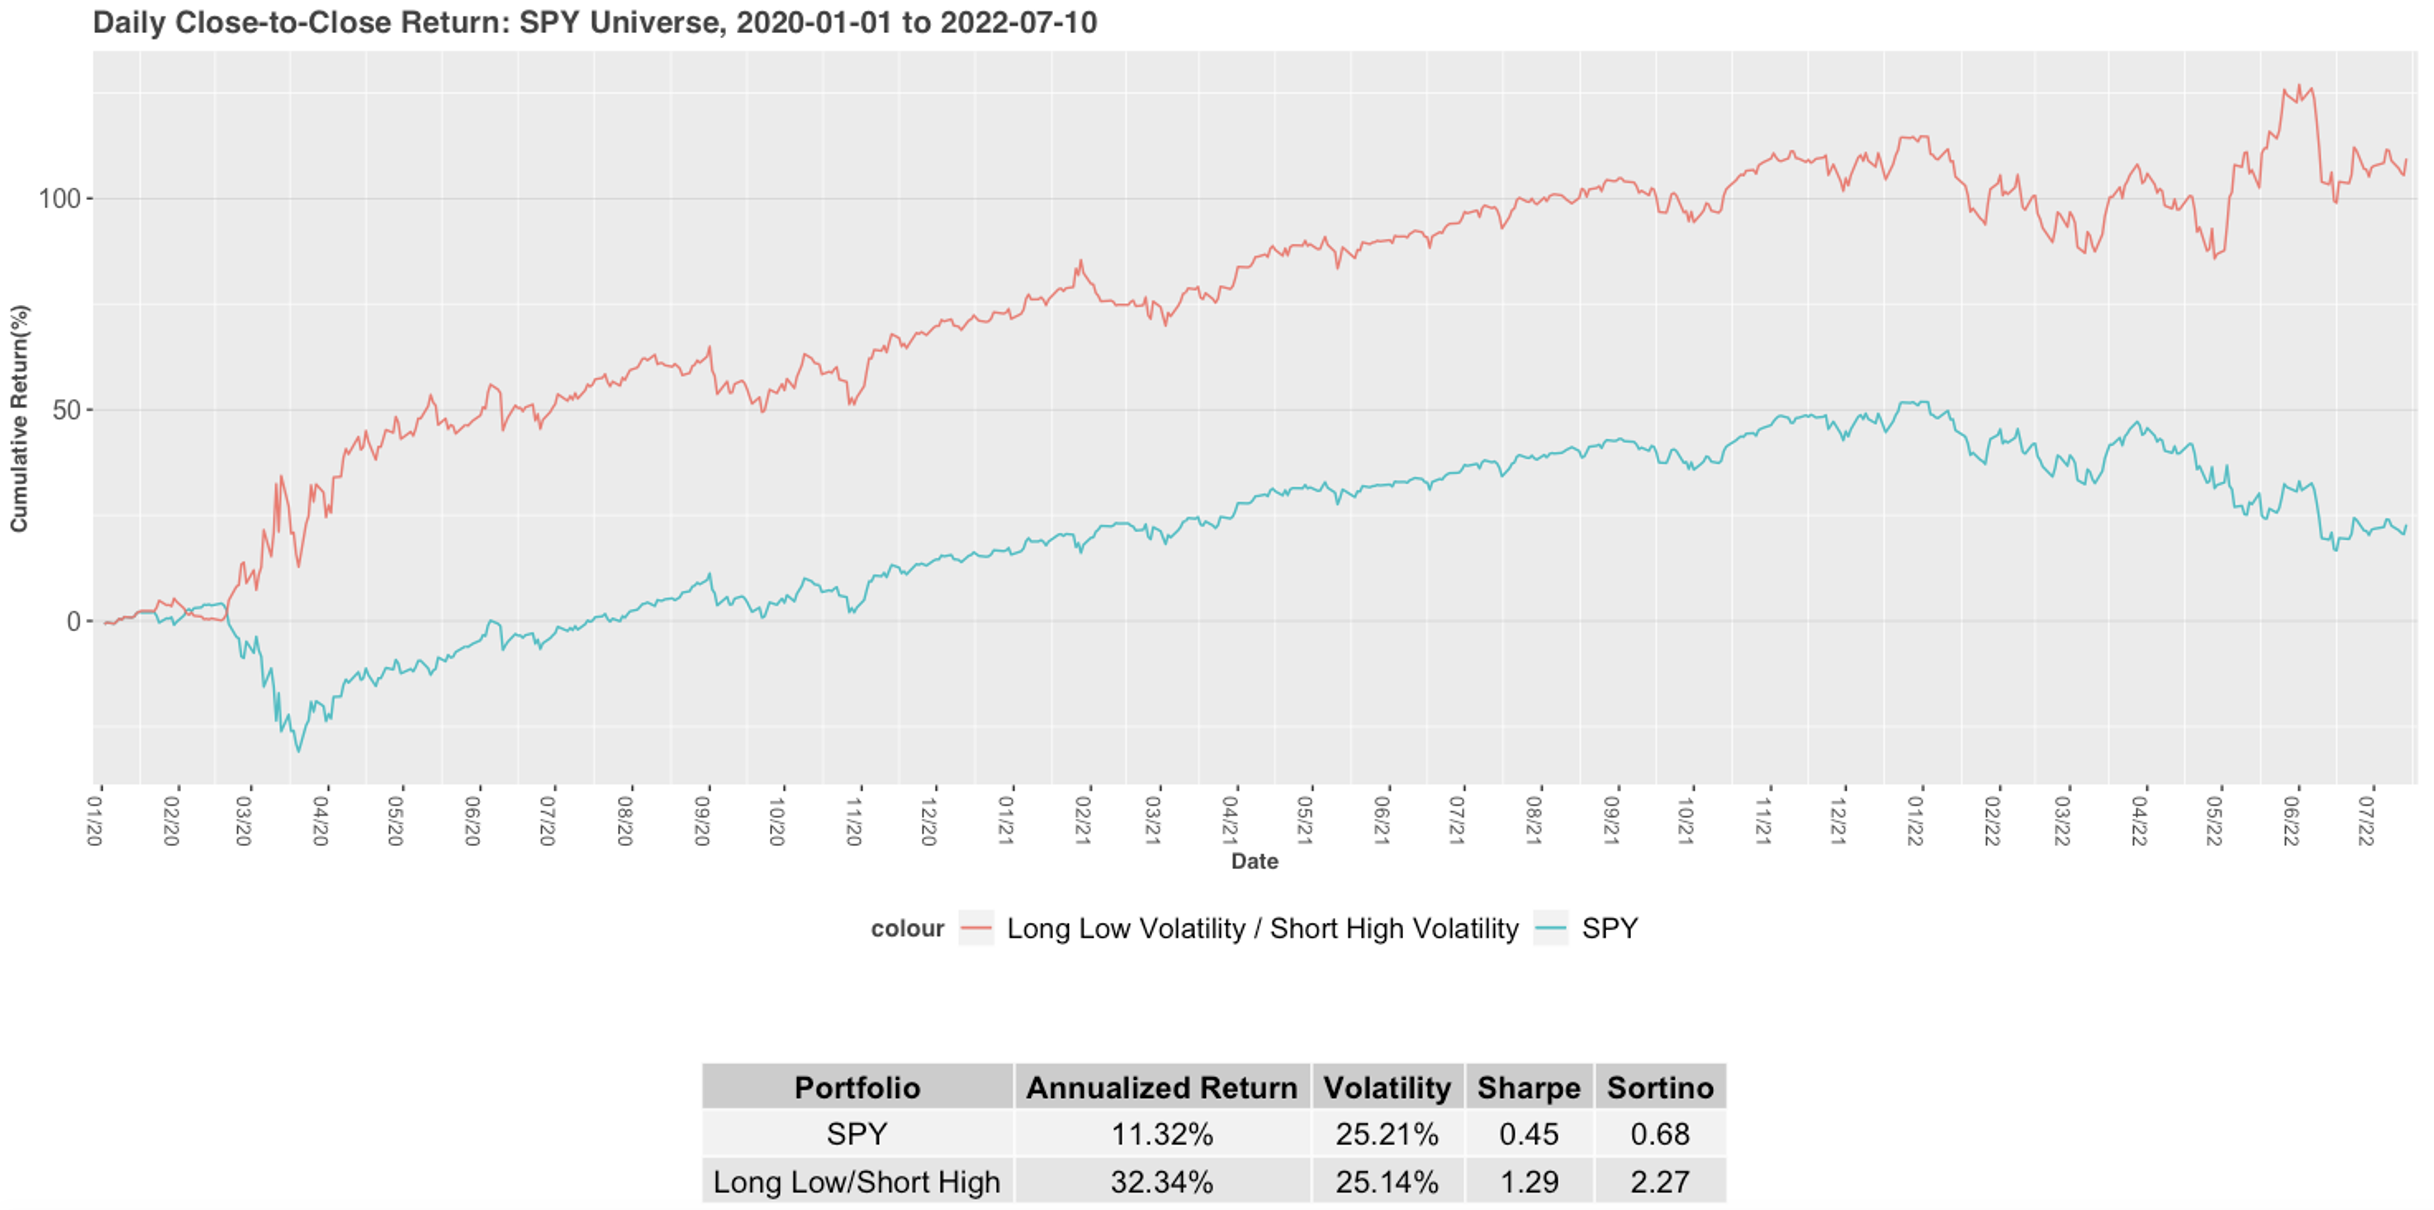
Taking a closer look, the separation since the beginning of 2020 is quite significant. Adding a short position to SPY when volatility on sentiment is high, has enhanced the portfolio’s return. Even though many of the days will maintain a long position, the Z-Volatility is predictive of downturns in the market since 2020. Traders could use this metric as an indicator to stay out of the market, or at the very least trade with more caution. The COVID-19 Pandemic led to a large amount of uncertainty surrounding the stock market and the direction its heading. A high Z_Volatility score indicates the public’s opinion is more uncertain about the direction of various stocks. This research shows the value of sentiment from Social Market Analytics in predicting macro-level events and price movements.

If you are interested in learning more about how SMA’s S-Factor data can help your trading strategies, please email us at contactus@socialmarketanalytics.com or schedule a demo using this link.

My name is Campbell Taylor. I am a rising senior and a Statistics major at The Ohio State University. Through my first few weeks as a Quantitative Research Intern for Social Market Analytics I’ve been exposed to alternative data and its applications in the financial market. In this research, I created a day trading strategy built around changes in sentiment on twitter.

Social Market Analytics (SMA) captures unstructured data through alternative sources such as Twitter. Using unique Natural Language Processing sentiment analysis, SMA rates tweets in real time and create metrics that enhance insights into equities’ market movements.

Sentiment factors used for this analysis are distributed through SMA’s S-Factor feed. The factors are:

  • S-Score: normalized representation of a stock’s sentiment on twitter over 24 hours
  • SV-Score: normalized representation of a stock’s indicative tweet volume over 24 hours
  • S-Buzz: measurement of unusual Twitter activity compared to the universe of stocks

A large S-Score (> 2) is associated with extreme positive sentiment on Twitter, while a small S-Score (< -2) is associated with extreme negative sentiment. The same applies for SV- Score. S-Buzz ranges from 0 to 4.5, with 1 being the statistical mean. The goal of this research is to use these sentiment factors overlaid with pricing momentum to develop a profitable daily trading strategy.

The momentum used for this research is defined as the following:

This isolates the pricing momentum to strictly overnight movement. Similarly, I used the differences in sentiment to capture the overnight sentiment changes. The two sentiment timestamps are taken at 9:10 AM EST of the current trading day and 3:40 PM EST of the previous trading day, both 20 minutes prior to market open and close. Subtracting the previous day’s closing sentiment from the current day’s opening sentiment isolates the overnight sentiment change.The target return can be defined as:

A popular trading strategy is buying securities with rising momentum and selling them when the momentum has appeared to be exhausted. My original hypothesis was that positive overnight sentiment movements would enhance the overnight pricing momentum. More specifically: a positive S-Score difference (increased positivity), SV-score difference (increased volume of tweets), or S-Buzz difference (more unusual activity) would lead to the positive momentum continuing until close of the trading day, and vis versa for negativity.

To find which sentiment movement was most significant in predicting returns, I built a logistic regression model. This models the probability of a discrete outcome given the input variables. In this case, the probability of positive open to close returns given the various overnight sentiment changes and the overnight pricing momentum. The idea being parameters that increase the probability of positive returns will create a trading strategy that would be more profitable than the market over time.

Before selecting the model, I checked the distribution of the variables to ensure there was no abnormalities in their distribution. The histograms below show the following distributions (left to right, up to down): Overnight Difference in S-Score, Overnight Difference in SV-Score, Overnight Difference in S-Buzz, Overnight Pricing Momentum, and Open to Close Returns. All the variables appear to be roughly normally distributed, which is beneficial for statistical modeling and taking the tails of the distribution.

Using the four remaining variables, I used a stepwise information criteria method to aid the selection of the best parameters for trading. The information criteria measure the model’s performance while considering the number of parameters used. To my surprise, the model showed that positive (negative) overnight momentum decreased (increased) the probability of positive open to close returns for the next trading day. Additionally, overnight momentum was more significant as a factor variable rather than a continuous variable. Meaning the sign of the momentum is more important than the magnitude of the momentum. Each of the sentiment changes were significant in predicting the return. A positive difference in S-Score and S-Buzz increased the probability of positive returns, while a positive difference in SV-score lowered it. While each variable is significant, it is important to consider the number of stocks that will pass the conditions of all parameters when trading. Very few daily stocks will satisfy all 3 specific sentiment parameters, which will lead to a large variance in results. Thus, it makes sense to narrow the model to one S-Factor variable. Selecting the S-Factor variable that has the most occurrences of extreme changes will give the most robust results. The difference in S-Score had more than double the number of stocks with extreme changes than SV-Score and S-Buzz. Therefore, the final trading strategy will be built around the difference in S-Score overlaid with overnight pricing momentum.

Since the difference in S-Score is a continuous variable that follows a normal distribution, I only wanted to trade on stocks with extreme overnight changes. I defined extreme changes as above 2 and below -2, like the S-Score variable itself. A difference in S-Score over 2 indicates there is an extreme increase in sentiment surrounding that stock on Twitter. Similarly, a difference in S-Score below -2 indicates an extreme decrease in sentiment.

I calculated the cumulative returns of 4 different trading strategies and the S&P 500 ETF trust (SPY) as the benchmark for the general market. Each of the strategies enter at market open and exit at market close with an equal weight placed on each stock. Two of the strategies will be long positions and two of them will be theoretical short positions. The long positions have parameters that increase the probability of positive returns, while the short positions have parameters that lower it.

The Long positions:

  • Trading only on stocks that had negative overnight momentum
  • Trading only on stocks that had negative overnight momentum, but an extreme increase in sentiment (difference in S-Score > 2)

The theoretical Short positions:

  • Trading only on stocks that had positive overnight momentum
  • Trading only on stocks that had positive overnight momentum, but an extreme decrease in sentiment (difference in S-Score < -2)

Trading with these 4 different strategies quantifies the effect that sentiment movement has on the overnight momentum. I expected the two long positions to give positive cumulative returns and the short positions to have negative cumulative returns. Based on the model, the long position with sentiment should give the highest returns while the short position with sentiment should give the lowest returns. Before calculating returns, I looked at the number of trades per day in the strategies with sentiment to ensure the trades won’t be too heavily weighted on one stock (top-down).

The x-axis of the histograms shows the number of trades made in a day, while the y-axis shows the number of days with that number. Both distributions suggest there will be some volatility in the number of trades per day. However, the mean and median number of trades for both strategies are high enough to ensure diversity for many of the days. There will be days where there are less than 10 trades, but those will be less than 15% of the trading days in a 10-year span. Therefore, the low volume days will be spread out and not affect the strength of the results. The average also isn’t too high to the point where it is impossible to execute the trades at the markets open. Knowing the number of trades was solid, I used these strategies to trade from December 1st 2011 to June 3rd 2022.

The time series graph shows the cumulative return of the strategies over time. Between April and June of 2020 there is a sharp increase in returns for the negative momentum with sentiment increase strategy. The abnormality can be attributed to the market condition following the beginning of lockdowns for the COVID-19 Pandemic. While markets were turbulent during this time, the long position with sentiment performed very well. Overnight sentiment movement had a significant impact on the pricing momentum. The long positions both gave positive cumulative returns, and the theoretical short positions gave negative cumulative returns. As the model suggested, trading stocks that had negative momentum with an extreme increase in sentiment gave the best returns. This strategy produced a cumulative return over 1400% in the 10-year time frame. The Sharpe and Sortino ratios suggest that the above-average returns are worth the potential volatility of this strategy. A Sharpe above 1 and Sortino above 2 are considered good for a portfolio. For the long positions, adding sentiment movement increased the Annualized Return by nearly 12%. While the effects were not as strong, adding sentiment decreased the Annualized Return of the short position by close to 7%. I then looked at how this strategy has performed since start of 2020.

The jump at the beginning is also during the lockdowns of the COVID-19 Pandemic. Each of the strategies jumped further in the direction the model predicted during this time. This time series graph follows the same behavior as the 10-year trend. The impact of the negative sentiment change on the positive momentum is more evident on this plot. Recently, the long position with sentiment strategy has performed even better than over the 10-year period. While maintaining strong Sharpe and Sortino ratios, the annualized return climbed to nearly 41%. Trading with this strategy would have given a 140% cumulative return since the first trading day of 2020. The short position with sentiment strategy also performed better in this time period. The negative overnight sentiment lowered the annualized returns by nearly 8%. Trading on the long/short positions with sentiment has been an effective trading strategy over time and shows no signs of slowing down.

The limitation with this strategy is the opening of the market being used as a part of the overnight momentum calculation and as the entry point for the trade. Therefore, there will be a delay in executing the trade. In practice this results in adding 5 cents to the opening price for the long positions and removing 5 cents to the opening price for the short positions. The returns will be a bit smaller than the ones calculated but will be very close.

Stocks have generally shown to revert to their mean following overnight movement. Adding sentiment changes appears to enhance the probability and magnitude of reversion. That is why trading on stocks where the overnight sentiment contradicts the overnight pricing momentum is a very profitable strategy. Following this strategy also removes holding stocks overnight where there is risk of news and events breaking after the market close. This research also exemplifies the predictive power of the S-Factors from Social Market Analytics. The overnight S-Score movement proved to have a significant impact on the open to close returns. Capturing the sentiment movement allows traders to identify securities where the price has not yet followed the direction of the public opinion.

To learn more about Social Market Analytics email us at ContactUs@SocialMarketAnalytics.com or schedule a demo using this link.

Social Market Analytics converts textual data into quantitative signals for the investment community. To complement our U.S. Equity feed, we recently launch a Twitter based sentiment feed covering the largest TSX (Toronto Stock Exchange) equities. The initial universe included 233 TSX equities, and recently expanded to include an additional 200+ equities. The out-of-sample date for this dataset is January 20th, 2022 with history extended back to the beginning of 2020.

Similar to other asset classes in SMA’s database, the TSX asset class publishes Activity, S-Factor, Short Squeeze, and Hard to Borrow data feeds. To test the robustness of this new asset class, we conducted Daily Quintile and Threshold tests on the S-Factor feed.

TSX Equities Quintiles

In this Quintile test we look at SMA’s S-Factor feed at 3:40 pm ET (20 minutes prior to Market Close). Stocks are placed into different Quintile buckets based on the value of their S-Score. The S-Score is one of fifteen factors supplied in SMA’s S-Factor feed and provides a daily view of Social Sentiment from Twitter. S-Scores greater than 2 or less than -2 are considered extreme sentiment, while values closer to 0 indicate neutral sentiment. The lowest 20% of S-Score values are placed in Quintile 1 while the highest 20% of S-Score values are placed in Quintile 5. We look at subsequent Close-to-Close returns with each stock equally weighted within each quintile. Below is the daily cumulative return series of the TSX asset class quintiles.

After placing stocks in their proper Quintiles and taking the average return of each bucket, stocks with higher S-Scores tend to outperform stocks with lower S-Scores. The graph above shows a monotonic factor. This graph includes a large spread between Quintiles 1 and 5, which would result in a cumulative return of nearly 70% in 27 months. On average, the TSX asset class publishes 141 securities each market day. This number will only increase as SMA’s TSX universe expands.

We further explore the S-Score signal by filtering on securities that had 3 or more Tweets within the previous 24 hours (S-Volume >= 3), then conduct the same quintile analysis.

This new filter reduces the number of securities distributed in the graph from 141 to 95 securities each day. However, it also increases the Sharpe ratio and spread between Quintile 1 and Quintile 5.

TSX Thresholds

For this test, we look at all TSX securities at 3:40 pm ET and place securities in the ‘Long’ bucket if their S-Score >= 2 and place securities in the ‘Short’ bucket if their S-Score =< -2. Since 2020, there are an average of 5 stocks per day in ‘Short’ bucket and 17 stocks per day in the ‘Long’ bucket. We look at the subsequent Close-to-Close return for each security. Securities are equally weighted within each portfolio. In the Long/Short portfolio, the Long and Short baskets are equally weighted.

When only looking at securities with S-Score >= 2, the annualized return of this portfolio is greater than 45%. This portfolio also has a Sharpe Ratio of 1.57 which is well above the market benchmark (S&P/TSX Composite Index).

Many insights can be extracted using SMA’s TSX Social Media feeds. To find out more on this topic, email us at ContactUs@SocialMarketAnalytics.com or schedule a meeting using our 1 on 1 Meeting Signup.

Social media beats the mainstream media on a regular basis.  Last week social media beat the news wire in reporting the MSFT acquisition of LNKD (blog post below) and Tuesday Twitter broke SCTY being acquired by TSLA.  This information is not theoretical – it is actionable data in our feed!

Tesla Motors lit up Twitter, yesterday, when CEO, Elon Musk came out and said their cars can float on water.  Tuesday June 21, the electric car manufacturer took everyone by surprise when they announced their decision to buy the solar panel company SolarCity (SCTY) minutes after the markets closed. The first news article to mention this came out at 4:18 PM CDT. Twitter had already gotten wind of this development 8 minutes prior with a tweet from the account “TopstepTrader”.

TSLA -SCTY

The tweet from “TopstepTrader” was deemed to be credible by Social Market Analytics’ sophisticated algorithm, which separates signal from noise to create actionable intelligence. The sentiment started to move in a positive direction the very next minute. By 16:12 CDT, SMA’s subscribers received ‘S-DeltaTM’ alerts on SCTY. The PredictiveSignalTM from SMA became positive at 16:13 CDT and at 16:18, when the first news article came out, the sentiment had already reached an extremely positive level, with Tweet volume soaring high; as was the stock price. Traders who incorporated social media sentiment from SMA into their trading models were ahead of the curve, making profits as the rest of the market was just learning of the news.

SCTY

The S-Delta metric also flagged this move.  The below chart illustrates the delta values for SCTY.  Delta represents the change in S-Score over a 15 minute lookback.  Delta values of 2 or higher are huge outliers. An SMA alarm based on Delta or S-Score would have provided an alert to this breaking news.

SCTY_Delta

To find out how you can use SMA S-Factors in your investment process contact us at Info@SocialMarketAnalytics.com


As is the case with most corporate events now, MSFT buying LNKD broke on Twitter first. The very first mention of this is any news article was at 7:38 AM (CDT) but Social Market Analytics (SMA) detected this 7 minutes ahead at 7:31. SMA’s patented algorithm digests, filters and evaluates Tweets in real time. The filtering process, a proprietary Tweet account filtering technology built by SMA, separates signal from noise by continuously scanning for accounts that are deemed credible to be included in the calculation process. The tweets from spam accounts are filtered right away.

The following are the 5 tweets that SMA received from these credible accounts in a matter of 13 seconds. All of them pointing towards the same positive news.

Tweets

The 7:32 AM sentiment, as a result, had already started moving positive. By the next minute, at 7:33 AM the sentiment was already positive and soaring up. By the time other news sources caught up to this news, at 7:38 AM, the sentiment was already very positive. The S-DeltaTM alerts which measures the 15 minute changes in the sentiment had started firing up at 7:33 AM as people took notice of this and the Tweet volume kept soaring.

SentimentVisuals

Contact SMA for more information about using Twitter based metrics in your investment process: info@SocialMarketAnalytics.com


Social Market Analytics (SMA) aggregates the intentions of  investors as expressed on the StockTwits platform.   SMA creates proprietary S-Factor metrics that quantitatively describe the current conversation relative to historical benchmarks.  This data provides strong predictors of future price movement.  This blog will focus on the deterministic nature of the StockTwits data set when aggregated into SMA S-Factors.    StockTwits is a community for active traders to share ideas enabling you to tap into the pulse of the market:  http://stocktwits.com/

The charts and tables below illustrate the subsequent open to close return of stocks that are being spoken about abnormally positively or abnormally negatively on StockTwits twenty minutes prior to market open.  Sharpe and Sortino ratios for the theoretical portfolios are included as well.  The SMA S-Score looks at the current conversation relative to historical benchmarks and creates effectively a Z-Score.

The Green line below is an index of subsequent open to close return of stocks with abnormally positive conversations on StockTwits prior to the market open.  The Red line is an index of the subsequent open to close return of stocks with an abnormally negative conversation prior to market open.  The black line represents the market open to close return and the blue line represents a theoretical long/short portfolio.

These charts clearly illustrate the predictive information present in the StockTwits message stream. If there was no predictive power in the StockTwits data set the Green, Red, and Black lines would be nearly identical -statistically not the case.  These signals are available at 9:10 am Eastern time well before the market open.

The chart below looks at the full SMA history of StockTwits based S-Factors.  The theoretical long portfolio has a Sharpe Ratio of 1.53, theoretical short portfolio -.82 Sharpe and LS portfolio has a Sharpe of 3.68.   Sortino Ratios are above one as well.  There is strong predictive power in this data.

FullHistoryStockTwits

The last year has been particularly challenging for the Hedge Fund community.  Below is a chart with the performance of the theoretical portfolios broken out from 1/1/2015 to current.  As you can see these portfolios performed well in this volatile market period.

LastYearStockTwits

For more information on these data sets please contact Pierce Crosby:  (pierce@stocktwits.com)  or Joe Gits: (joeg@socialmarketanalytics.com)

Regards,

Joe

Wow, what a ride 2015 was with the S&P 500 closing slightly down for the year.  As we head into 2016 are you going to continue to look at the same factors as everyone else or maybe try something new?

Below are the returns for stocks with significantly positive and negative pre-market open S-Scores.   Stocks with High pre-market open sentiment scores had a cumulative return of 12.19% versus an SP 500 open to close return of -.38%.  Stocks with a low pre-market open sentiment score had a cumulative open to close performance of -34%.  Stocks with high sentiment scores outperformed and stocks with low sentiment scores under-performed.  With significant Sharpes and Sortinos.  Combining S-Factors with your selection criteria and risk management can add a dynamic new factor to your security selection.

These charts use the S-Factor S-Score.  SMA publishes and family of S-Factors  to clearly identify the tone of the social media conversation.  To learn more go to: https://socialmarketanalytics.com/process.

returns2015


Returns2015Tables

Returns2015FullHistory

Returns2015FullHistoryTable

Social Market Analytics has been publishing the performance characteristics of stocks with high and low sentiment over the last four years.  Last year it was difficult to find success with traditional factors.  SMA S-Factors helped our customers generate out-performance.   Please contact Social Market Analytics to explore how sentiment based factors can be included in your models: ContactUs@SocialMarketAnalytics.com.


People ask about the persistence of SMA sentiment signals over time.   The signal length is dependent on the S-Factor used.   S-Mean for example represents a 20 day look back period and is generally used as a longer term signal.  We looked at a theoretical strategy using a universe of the Russell 1000 and S-Factors: S-Score, S-Volume and price.  It is not intended as a proposal of a trading strategy using S-Factors as a single factor in an alpha model it does illustrate the persistence of the signal over time.

We primarily looked at the signal prior to market open instead of prior days close to include the most recent social media conversation in the metrics.  If you use a sentiment score from the prior days close you don’t include overnight information such as news, foreign markets, and indication of market open…

The universe of stocks considered is the Russell 1000 representation as of 06/26/2015.  The back test period is 2011-12-01 to 2015-11-12.  There are no transaction costs/impact costs assumptions included in this analysis.

The simulation uses S-Score > 3 / S-Score < -3 AND S-Volume > 5 AND Price at Entry > $5.  An S-Score > 3 means the current conversation is more positive than 99% of conversations over the look back period (20 days).  The reason for choosing the threshold of 3 for S-Score is motivated, in part; on research results presented by Markit using the SMA S-Factors (contact us for the research).  The position holding period is Open to Close (+2), (i.e. close 2 business days from now).  The S-Factors signals used were selected at 09:10 AM (ET).

In the below chart, the Green Curve shows the results of going long on Positive Signal (S-Score positive with the thresholds used).  Similarly, the Red Curve shows the returns of the negative (S-Score <-3, negative return is good in this case). The Blue Curve is the result of going long on Positive Signal Portfolio and short the Negative Signal Portfolio each day.   Black Curve is the ONEK ETF (Russell 1000 SPDR ETF) and serves as a market reference for the back test period.  Risk adjusted performance measures (Sharpe, Sortino) and average daily returns are presented for each filter.

The results of Open to Close (+2) Strategy using |S-Score|> 3 & S-Volume > 5 & Entry Price > $5 signal at 09:10 AM are below.  To test the strength of a signal with strong threshold, we decided to hold the position for 3 days, (buying at the open when the signal met requirements of the filter and selling it at the close 2 business days later).  If a stock appears on 2 consecutive days, the trades are made in isolation, irrespective of the position that is held due to previous signal. The Positive and Long Short outperform the ONEK benchmark.  A large spread between Positive results and the benchmark is evident.

In our simulation the positive S-Score portfolio returns 23 bps per day versus the benchmark of 9 bps per day.  The long/short portfolio returns 28 bps versus the 9 bps per day for the benchmark.  Certainly significant reason for further analysis of adding sentiment signals to your portfolio.

These results illustrate that adding S-Volume and price filters, in conjunction with S-Score, yields significant positive returns performance.

Please contact us for much more detail and other back test or to explore how sentiment metrics can be used in your environment.

R1000 S-Score

RtnsTable

Smart Beta Sentiment Enhanced ETF Performance Analysis

At SMA we continuously research our data.  Below we discuss modifying weights of the SPDR SPY ETF based on sentiment values and examine the impact on return.  Please contact SMA (info@SocialMarketAnalytics.com) to learn more.

The SPDR SPY ETF is a cap-weighted ETF which closely replicates the performance of the S&P 500. Our objective is to develop a “smart beta” strategy using the social media sentiment levels of individuals ETF constituents and amplify or accentuate the weights of the constituents in the ETF while keeping the Assets under Management constant. The transaction cost assumption is ignored for both the original and the enhanced ETF.

One of the strategies explored was looking at the sentiment levels an hour before the close (2:55 PM Eastern Time) and re-balancing the weights according to that. The stocks were bought or sold (to reduce position as per new weight only, NO short selling) at the close of the day and the positions were maintained until the next day when the re-balancing was performed again. To explore the weight modification methodology please contact SMA.

Our re-balance strategy keeps the AUM constant with no need for additional funds. Another strategy explored was to use a “lagged” sentiment. The lag being a day. So, for adjusting the weights today, we looked at the sentiment at 2:55 PM yesterday, and changed the positions based on that.

The results for the cumulative returns calculated over the period extending 7/31/2013-8/31/2015 are summarized below.  Chart 1 shows the cumulative returns over the period for the “Original” which calculates fund returns using positions and closing price data. The “500% PM” makes the calculations using enhanced weights based on the pre-close sentiment. The “500% PM Lagged” has enhanced performance using pre-close sentiment from previous (trading) day.

Chart 2 shows the cumulative out performance, for the 2 “smart beta” strategies.  As you can see both strategies track the SPDR SPY ETF while outperforming performance.  You see the benefit of adding sentiment to your calculation process without increasing risk.

Chart1

Chart2

This is preliminary research we will be enhancing and updating over the coming weeks.

Regards,

SMA

Social Market Analytics has been offering API access to our data since inception. Fewer people know we also offer powerful visualization and screening tools.  We offer two ways to access our data without programming.

First, we have a robust Excel Add-in that allows for Real-Time screening and historical retrieval.  This functionality is ideal for integrating sentiment data into Excel based research platforms.  You can screen for user defined pricing and sentiment criteria or upload a watch list and monitor sentiment activity on these securities in real-time.

Add-In

The SMA Sentiment Dashboard is a real-time visual representation of sentiment changes for the entire universe or your watch list.  the below screen provides a real-time view of stocks with large changes is social media.  Users can set criteria for filtering for the most relevant securities.

Dashboard1

The dashboard tracks sentiment for Stocks, commodities, currencies, indexes, sectors and industries. Below is an illustration of industry level sentiment.

Industry

In, addition users can set screening criteria for real-time alerting by email, text or private Tweet.   Alerts can be specified for individual securities, watch list of securities or the entire universe.

ExistingAlerts

These are just some of the visualization tools SMA offers.  For a full demonstration of trial contact us at Sales@SocialMarketAnalytics.com

Thanks,

SMA