Posts

One of the most closely followed events on the corporate calendar are earnings calls. This gives executives the opportunity to comment on earnings and answer questions from those outside of the company. Using our patented Natural Language Processing, Social Market Analytics scores Earnings Call Transcripts in real time and creates metrics based on sentiment, word count, and section count. For this research, we look specifically at the question-and-answer section of call transcripts. The theory is that isolating the section of the call where executives aren’t controlling the topic of conversation will give a more accurate assessment of the sentiment surrounding earnings results. We use Sum of Sentiment to quantify the positivity of the call. Sum of Sentiment adds all the words and phrases tagged in the section with sentiment. The following histogram shows the distribution of the Sum of Sentiment variable.

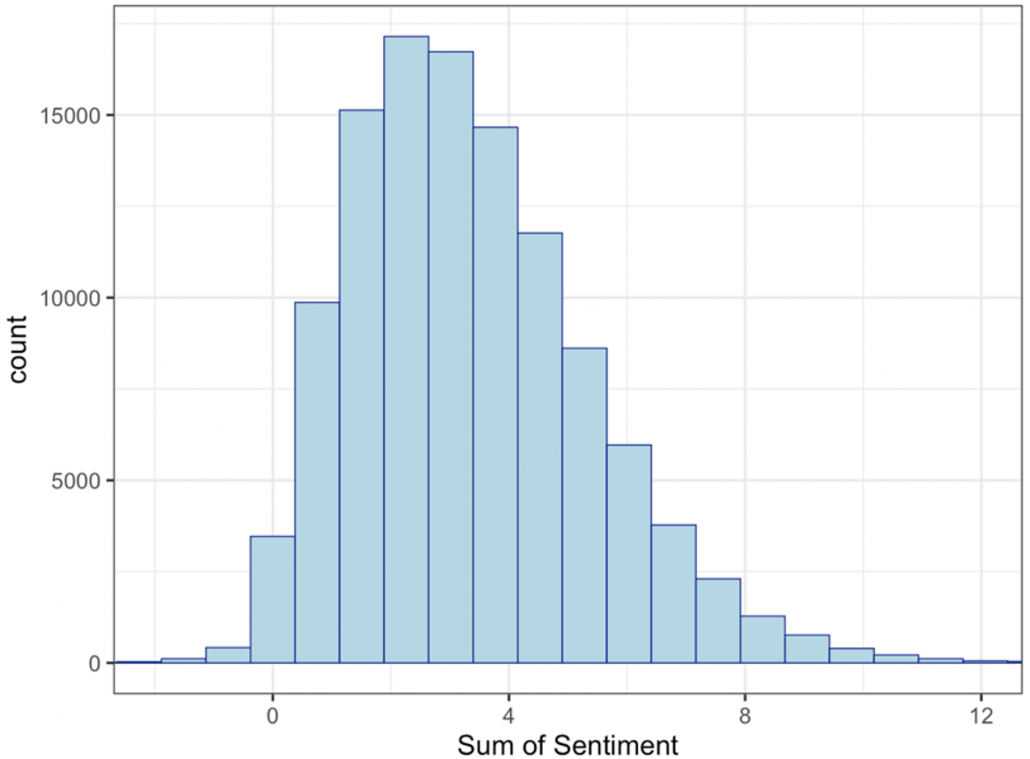
The Sum of Sentiment is centered around 3.5 and is roughly normal with a heavy tail skewing right. As executives of companies want to express good things to come, it makes sense that the sum is predominantly positive. Still some earnings calls are more positive than others. Based on the distribution of sentiment, we defined an extremely positive earning call as having a sum greater than 5 and a negative earning call as having a sum less than 1.5. These thresholds give a roughly equal number of instances over the past 14 years. We took these thresholds and compared returns for different time periods following the Earnings Call. Time periods were subsequent Open-to-Close; subsequent Close-to-Close, subsequent week return, subsequent month return, and subsequent quarter return. Since earnings calls are spaced throughout the year, it is difficult to compound the subsequent returns. Instead, we will be looking at average excess returns for each threshold. The excess return for each security is calculated by subtracting the SPY return of the same time frame from the securities return. Our hypothesis is that the average excess returns for the extremely positive earnings calls will be higher than those for negative earnings calls. We calculated returns of all instances since the end of 2009.

For long-term holdings, the average excess return for high sentiment earnings call companies was strongly positive. On the contrary, negative sentiment earning calls company returns were negative for every time frame. Quarterly returns highlight the importance of a positive earnings call as the average excess return is close to .8% higher than negative. The biggest takeaway from different time periods was the large difference in returns between the next Open-to-Close and the next Close-to-Close, especially those with a high sentiment. Entering on the subsequent close rather than open dropped the excess returns by .8% and made them negative. The next close to close returns were negative regardless of the sentiment threshold. Waiting to enter removed the benefit of positivity from high sentiment. We looked at the returns of these two-time frames with high sentiment over the past 13 years.

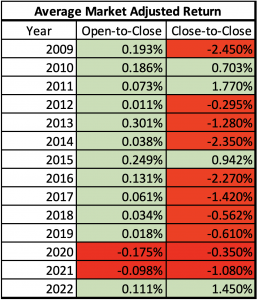
Looking at the past 14-year performance: The Open-to-Close excess returns were positive 12/14 years and Close-to-Close excess returns were positive 4/14 years. The two negative years for the Open-to-Close also came during an abnormal period of the COVID-19 pandemic. Immediate open to close return benefits from the high sentiment far more than the close to close. Therefore, there is a premium on knowing the sentiment of an Earnings Call in real time and entering the next open to maximize short term returns. Instead of manually reading earnings calls to gain insights, traders can use the sentiment summarized by Social Market Analytics to select positions. Waiting to enter on positive earnings calls generally hurts the short-term returns. Social Market Analytics’ scoring on Earning Calls can give traders the advantage of entering the position as quickly as possible for immediate returns, while also providing a holding option for quarterly returns.

If you are interested in learning more about how SMA’s Earnings data can help your trading strategies, please email us at contactus@socialmarketanalytics.com or schedule a demo using this link.

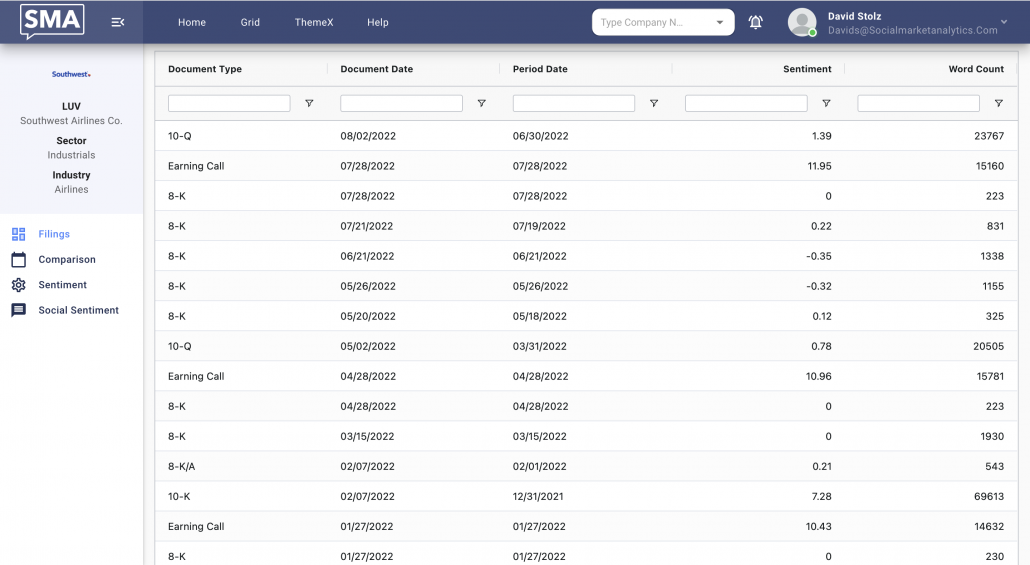
Explore sentiment on earnings calls and all corporate filings on the SMA Unstructured Data Terminal below.

The target of this research was to find an indicator that helps predict the direction of the overall US Equity market for the next week using sentiment data from the previous week. The hypothesis is when there is high volatility in sentiment over the previous week, which means investors have differing opinions, the subsequent week overall market performance will underperform. When volatility on sentiment is low or neutral, the crowd has reached a consensus and the general market will outperform over the next week. The sentiment metric used to represent volatility is Raw-Volatility in SMA’s S-Factor data feed, which captures the volatility of the sentiment from Twitter conversations. All Raw-Volatility data points were taken from the 3:40 pm ET timestamp (20 minutes before the market close). We calculated the summation of Raw-Volatility for each date as a proxy to represent the volatility of Twitter social sentiment on the entire market. The exact calculation is as follows, where “N” is the number of companies with sentiment on that date and “D” is the date:

We then created a 7-day standardized volatility using a 91-day benchmark:

This Z_Volatility score follows a roughly normal distribution.

Using the S&P 500 ETF Trust (SPY) as a proxy of general market performance, we then look at the relationship between Z_Volatility and SPY’s return series. The daily close-to-close return is calculated as:

Hypothesis: When Z_Volatility for the previous closing Date is high, the subsequent market performance will be lower. When Z_Volatility is low or neutral, the next day’s market performance will be higher.

To test this, our strategy is to open short position of SPY when Z_Volatility > 1. When Z_Volatiltiy is =< 1, the portfolio treats SPY as a long position. This hypothetical portfolio is then compared to SPY over the past 10 years:

Prior to the COVID-19 pandemic, which began in early 2020, SPY outperformed the modified portfolio. However, since then the behavior of this factor changed drastically. Here is the same graph as above starting in 2020:

Taking a closer look, the separation since the beginning of 2020 is quite significant. Adding a short position to SPY when volatility on sentiment is high, has enhanced the portfolio’s return. Even though many of the days will maintain a long position, the Z-Volatility is predictive of downturns in the market since 2020. Traders could use this metric as an indicator to stay out of the market, or at the very least trade with more caution. The COVID-19 Pandemic led to a large amount of uncertainty surrounding the stock market and the direction its heading. A high Z_Volatility score indicates the public’s opinion is more uncertain about the direction of various stocks. This research shows the value of sentiment from Social Market Analytics in predicting macro-level events and price movements.

If you are interested in learning more about how SMA’s S-Factor data can help your trading strategies, please email us at contactus@socialmarketanalytics.com or schedule a demo using this link.

My name is Campbell Taylor. I am a rising senior and a Statistics major at The Ohio State University. Through my first few weeks as a Quantitative Research Intern for Social Market Analytics I’ve been exposed to alternative data and its applications in the financial market. In this research, I created a day trading strategy built around changes in sentiment on twitter.

Social Market Analytics (SMA) captures unstructured data through alternative sources such as Twitter. Using unique Natural Language Processing sentiment analysis, SMA rates tweets in real time and create metrics that enhance insights into equities’ market movements.

Sentiment factors used for this analysis are distributed through SMA’s S-Factor feed. The factors are:

  • S-Score: normalized representation of a stock’s sentiment on twitter over 24 hours
  • SV-Score: normalized representation of a stock’s indicative tweet volume over 24 hours
  • S-Buzz: measurement of unusual Twitter activity compared to the universe of stocks

A large S-Score (> 2) is associated with extreme positive sentiment on Twitter, while a small S-Score (< -2) is associated with extreme negative sentiment. The same applies for SV- Score. S-Buzz ranges from 0 to 4.5, with 1 being the statistical mean. The goal of this research is to use these sentiment factors overlaid with pricing momentum to develop a profitable daily trading strategy.

The momentum used for this research is defined as the following:

This isolates the pricing momentum to strictly overnight movement. Similarly, I used the differences in sentiment to capture the overnight sentiment changes. The two sentiment timestamps are taken at 9:10 AM EST of the current trading day and 3:40 PM EST of the previous trading day, both 20 minutes prior to market open and close. Subtracting the previous day’s closing sentiment from the current day’s opening sentiment isolates the overnight sentiment change.The target return can be defined as:

A popular trading strategy is buying securities with rising momentum and selling them when the momentum has appeared to be exhausted. My original hypothesis was that positive overnight sentiment movements would enhance the overnight pricing momentum. More specifically: a positive S-Score difference (increased positivity), SV-score difference (increased volume of tweets), or S-Buzz difference (more unusual activity) would lead to the positive momentum continuing until close of the trading day, and vis versa for negativity.

To find which sentiment movement was most significant in predicting returns, I built a logistic regression model. This models the probability of a discrete outcome given the input variables. In this case, the probability of positive open to close returns given the various overnight sentiment changes and the overnight pricing momentum. The idea being parameters that increase the probability of positive returns will create a trading strategy that would be more profitable than the market over time.

Before selecting the model, I checked the distribution of the variables to ensure there was no abnormalities in their distribution. The histograms below show the following distributions (left to right, up to down): Overnight Difference in S-Score, Overnight Difference in SV-Score, Overnight Difference in S-Buzz, Overnight Pricing Momentum, and Open to Close Returns. All the variables appear to be roughly normally distributed, which is beneficial for statistical modeling and taking the tails of the distribution.

Using the four remaining variables, I used a stepwise information criteria method to aid the selection of the best parameters for trading. The information criteria measure the model’s performance while considering the number of parameters used. To my surprise, the model showed that positive (negative) overnight momentum decreased (increased) the probability of positive open to close returns for the next trading day. Additionally, overnight momentum was more significant as a factor variable rather than a continuous variable. Meaning the sign of the momentum is more important than the magnitude of the momentum. Each of the sentiment changes were significant in predicting the return. A positive difference in S-Score and S-Buzz increased the probability of positive returns, while a positive difference in SV-score lowered it. While each variable is significant, it is important to consider the number of stocks that will pass the conditions of all parameters when trading. Very few daily stocks will satisfy all 3 specific sentiment parameters, which will lead to a large variance in results. Thus, it makes sense to narrow the model to one S-Factor variable. Selecting the S-Factor variable that has the most occurrences of extreme changes will give the most robust results. The difference in S-Score had more than double the number of stocks with extreme changes than SV-Score and S-Buzz. Therefore, the final trading strategy will be built around the difference in S-Score overlaid with overnight pricing momentum.

Since the difference in S-Score is a continuous variable that follows a normal distribution, I only wanted to trade on stocks with extreme overnight changes. I defined extreme changes as above 2 and below -2, like the S-Score variable itself. A difference in S-Score over 2 indicates there is an extreme increase in sentiment surrounding that stock on Twitter. Similarly, a difference in S-Score below -2 indicates an extreme decrease in sentiment.

I calculated the cumulative returns of 4 different trading strategies and the S&P 500 ETF trust (SPY) as the benchmark for the general market. Each of the strategies enter at market open and exit at market close with an equal weight placed on each stock. Two of the strategies will be long positions and two of them will be theoretical short positions. The long positions have parameters that increase the probability of positive returns, while the short positions have parameters that lower it.

The Long positions:

  • Trading only on stocks that had negative overnight momentum
  • Trading only on stocks that had negative overnight momentum, but an extreme increase in sentiment (difference in S-Score > 2)

The theoretical Short positions:

  • Trading only on stocks that had positive overnight momentum
  • Trading only on stocks that had positive overnight momentum, but an extreme decrease in sentiment (difference in S-Score < -2)

Trading with these 4 different strategies quantifies the effect that sentiment movement has on the overnight momentum. I expected the two long positions to give positive cumulative returns and the short positions to have negative cumulative returns. Based on the model, the long position with sentiment should give the highest returns while the short position with sentiment should give the lowest returns. Before calculating returns, I looked at the number of trades per day in the strategies with sentiment to ensure the trades won’t be too heavily weighted on one stock (top-down).

The x-axis of the histograms shows the number of trades made in a day, while the y-axis shows the number of days with that number. Both distributions suggest there will be some volatility in the number of trades per day. However, the mean and median number of trades for both strategies are high enough to ensure diversity for many of the days. There will be days where there are less than 10 trades, but those will be less than 15% of the trading days in a 10-year span. Therefore, the low volume days will be spread out and not affect the strength of the results. The average also isn’t too high to the point where it is impossible to execute the trades at the markets open. Knowing the number of trades was solid, I used these strategies to trade from December 1st 2011 to June 3rd 2022.

The time series graph shows the cumulative return of the strategies over time. Between April and June of 2020 there is a sharp increase in returns for the negative momentum with sentiment increase strategy. The abnormality can be attributed to the market condition following the beginning of lockdowns for the COVID-19 Pandemic. While markets were turbulent during this time, the long position with sentiment performed very well. Overnight sentiment movement had a significant impact on the pricing momentum. The long positions both gave positive cumulative returns, and the theoretical short positions gave negative cumulative returns. As the model suggested, trading stocks that had negative momentum with an extreme increase in sentiment gave the best returns. This strategy produced a cumulative return over 1400% in the 10-year time frame. The Sharpe and Sortino ratios suggest that the above-average returns are worth the potential volatility of this strategy. A Sharpe above 1 and Sortino above 2 are considered good for a portfolio. For the long positions, adding sentiment movement increased the Annualized Return by nearly 12%. While the effects were not as strong, adding sentiment decreased the Annualized Return of the short position by close to 7%. I then looked at how this strategy has performed since start of 2020.

The jump at the beginning is also during the lockdowns of the COVID-19 Pandemic. Each of the strategies jumped further in the direction the model predicted during this time. This time series graph follows the same behavior as the 10-year trend. The impact of the negative sentiment change on the positive momentum is more evident on this plot. Recently, the long position with sentiment strategy has performed even better than over the 10-year period. While maintaining strong Sharpe and Sortino ratios, the annualized return climbed to nearly 41%. Trading with this strategy would have given a 140% cumulative return since the first trading day of 2020. The short position with sentiment strategy also performed better in this time period. The negative overnight sentiment lowered the annualized returns by nearly 8%. Trading on the long/short positions with sentiment has been an effective trading strategy over time and shows no signs of slowing down.

The limitation with this strategy is the opening of the market being used as a part of the overnight momentum calculation and as the entry point for the trade. Therefore, there will be a delay in executing the trade. In practice this results in adding 5 cents to the opening price for the long positions and removing 5 cents to the opening price for the short positions. The returns will be a bit smaller than the ones calculated but will be very close.

Stocks have generally shown to revert to their mean following overnight movement. Adding sentiment changes appears to enhance the probability and magnitude of reversion. That is why trading on stocks where the overnight sentiment contradicts the overnight pricing momentum is a very profitable strategy. Following this strategy also removes holding stocks overnight where there is risk of news and events breaking after the market close. This research also exemplifies the predictive power of the S-Factors from Social Market Analytics. The overnight S-Score movement proved to have a significant impact on the open to close returns. Capturing the sentiment movement allows traders to identify securities where the price has not yet followed the direction of the public opinion.

To learn more about Social Market Analytics email us at ContactUs@SocialMarketAnalytics.com or schedule a demo using this link.

The SMA research team has done a tremendous amount of research on Machine readable filings. This Blog is taken from a research paper authored by Koby Weisman. SMA partnered with S&P Global Market Intelligence to provide textual data in U.S. SEC EDGAR filings broken down by heading with text underneath (i.e. Parts, Items). The textual data is parsed to create historical baselines for 10-Ks, 10-Qs, 8-Ks, 20-Fs and other filings. This paper focuses on word counts, sentiment factors, and the change in those factors. There are 20 filing types in the MRF product, however this paper analyzes 10-Ks and 10-Qs building on existing academic research including Lazy Prices1.

The MRF dataset includes seven factors which are described in the table below. These factors are produced at the Item, Part, and Total Document level to provide a comprehensive view of what sections within the document have changed.

Subscribers of the MRF dataset can create derivative metrics stemming from the seven factors provided. For instance, one metric explored in this paper is Sentiment per Word. That factor is calculated by dividing Sentiment Sum by Word Count. Another factor explored is Percentage of Sentiment Hits which is calculated by dividing Sentiment Hits by Word Count. These factors and other derivative factors are calculated to normalize sentiment based on the length of document.

Methodology

The MRF dataset provides word counts and sentiment factors throughout the entire document, each part, and each item of the quarterly or annual report. In order to test our hypothesis that larger changes in SEC Edgar filings underperform smaller changes, we created metrics that exemplify ‘changes’ in a report.

The authors of Lazy Prices categorized changes in filings using a variety of similarity metrics (cosine similarity, Jaccard similarity, minimum edit distance, and simple similarity). In our analysis we use raw change in word count as proxy for similarity scores. Raw change in word count is the difference between the word count in two filings. This analysis looks at the Quarter-over-Quarter changes in regulatory filings. Each 10-K and 10-Q is compared to the most recent 10-K and 10-Q from the same company.

In addition to word count, this analysis explores other factors included in the MRF dataset which contain sentiment scores, word counts categorized by sentiment, and factors that combine word counts and sentiment.

Lazy Prices makes no mention of their universe, so we used all securities over five US dollars. The benchmark used, called ‘Universe’, is the average return of all stocks in any Quintile portfolio at that point in time. The analysis begins in 2007 and concludes at the end of 2019.

When computing calendar-time portfolio returns, stocks enter buckets depending on the factor or the raw change in that factor. Stocks enter the portfolio in the month the report was released. Portfolios are rebalanced monthly to introduce new filings submitted in the most recent month. Note that average portfolio size can differ due to documents having the same value.

Results

Results below show graphs and metrics related to calendar-time portfolio returns. ‘Q1’, or Quintile 1, contains stocks with the lowest value of the factor while ‘Q5’ encompasses stocks with the highest value of the factor.

We first looked at metrics on the total document level. This contains data embedded at the Item and Part level of a regulatory filing, which is then rolled up to the document level.

The graph and table above exemplify how Raw Change in Word Count can enhance stock selection. The green line represents securities that have the largest increase in Word Count while the red line denotes securities that have the largest decrease in Word Count. The red line, Quintile 1, outperforms all other quintiles while the green line, Quintile 5, underperforms all other quintiles.

As filings become longer or wordier compared to the company’s most previous filing, returns tend to drop compared to the universe. Regulatory filings are intended to adequately warn investors or potential investors about the company’s actions and strategies. If there are more warnings and explanations of the company’s actions, then the company isn’t as stable and thus underperforms the market.

As filings become shorter or more concise, subsequent stock returns outperform the universe. Companies that have a decrease in word count do not boast of events or products, but rather provide succinct statements. Also, one-off events that were in the company’s previous regulatory filing are taken out of the document meaning that the event was resolved.

The difference in monthly returns between the two lines (Q1 – Q5) has a T-Statistic of 3.64 and is proven significant at a 95% confidence level, thus we reject the Null Hypothesis that the Average Monthly Return equals 0.

The graph above exemplifies how a change in the number of subsections is an indicative source of future stock returns. This metric is a round integer with a small range so many stocks have the same value, which is why the average count in each bucket is uneven.

Subsections are counted at the Item level and are included if there is a specific topic to discuss. If there are more subsections included in the document (Quintile 5, green line) compared to the previous document, the stock price underperforms its peers. When there is a decrease in the number of subsections (Quintile 1, red line) the stock outperforms its peers.

Subsections are added to a regulatory filing when there’s a specific topic to discuss. Subsection Count and Word Count are correlated because as there are more topics to discuss, there are more words in the document. The addition of a new subsection means there is an event occurring and the company needs to adequately warn its investors. If there are more subsections, then the company has more events that could risk the future value of the company.

The monthly return difference between the two lines (Q1 – Q5) has a high 5.32 T-Statistic and is proven significant at a 95% confidence level. The hit rate, which is the percentage of times the return of the portfolio is greater than 0.00%, is extremely high at 68.59%. This means we reject the Null Hypothesis that the Average Monthly Return equals 0.

The above graph shows how the Total Document’s average sentiment can be a predictive source. The green line (Quintile 5) has the highest Average Sentiment value and outperforms all other stocks in the universe. Not only does Quintile 5 outperform the rest of the universe, but it also does so with the least amount of risk.

Through SMA’s Natural Language Processing all words in the document are read and assigned a score based on the sentiment of those words. If there is more positive language used throughout the document, the security tends to overperform the market. On the other side, if there is more negative language, the security underperforms its peers.

The red line (Quintile 1) underperforms its peers, but not by a significant amount. Even though the difference between Quintile 5 and Quintile 1 is not proven significant at a 95% confidence level, this factor provides additional alpha on the Long side.

We next looked at the Management Discussion & Analysis section of regulatory filings. This section is unique because of how unstructured it is compared to all other sections. It encompasses how management views the trajectory of the business and future events.

The chart above shows the Quintiles for Percentage of Sentiment Hits. This metric is calculated by dividing Sentiment Hits by Word Count. This is the percentage of the total document that had financial lexicon pertaining to sentiment (either positive or negative).

Quintile 5 (green line) represents the highest Percentage of Sentiment Hits, which outperforms all portfolios. Quintile 1 (red line) underperforms all portfolios. Companies that talk more about its performance in financial terms with sentiment are upfront. This transparency is beneficial for the company as they are forthright with investors. On the other hand, if the MD&A section has a small Percentage of Sentiment Hits that means the company is speaking about information not related to the financial status of the company. These companies don’t provide as much important information or use additional language that is not required. This lack of transparency devalues the company in the eyes of the investors.

The difference between Quintile 5 and Quintile 1 is proven significant at a 95% confidence level and provides a unique source of alpha.

The factor Sentiment per Word is calculated by dividing Sentiment Sum by Word Count. Longer documents are more likely to have an extreme value in Sentiment Sum. The rationale for this is if a document has more words, it is more likely to have more sentiment hits, thus a more extreme value for Sentiment Sum. The Sentiment per Word factor normalizes the magnitude of sentiment based on the length of the document.

Here we see Quintile 5 (green line) outperform and Quintile 1 (red line) underperform all other portfolios. The difference between the two is not proven significant, however this metric still provides insights on the Long side as Quintile 5 has the highest returns with less risk. If a company has a higher Sentiment per Word, then there is more of an upwards outlook on the future of the company and its events. A low Sentiment per Word means the company is negative when speaking about the company’s actions. This would attribute to a lack of confidence in the company’s future.

We last looked at the Risk Factors section of regulatory filings. This section generally has a negative tone and states what could go wrong in the company while adequately warning investors.

The factor plotted above, Positive and Negative Hits Difference, is the difference between Positive Hits and Negative Hits. In this graph Quintile 5 (green line) represents filings with a larger number of positive hits than negative hits, which underperforms all other portfolios. Quintile 1 (red line) contains filings that have significantly more negative hits than positive hits, which outperforms all portfolios. Filings with positive language in the Risk Factors section lack truth and transparency which leads to an underperformance. If the company is upfront about the risks of investing and doesn’t put a positive spin on the risks, the investors have more confidence in the company.

Conclusion

Machine Readable Filings is the most advanced and thorough product on the market for drilling into the un-tapped value of textual data in regulatory filings. These filings track how companies evolve and approach strategy in the face of micro and macro trends and the effect of these trends on their short- and long-term goals. While much in these documents do not change over successive quarters and years, the ability to quantify change and the location of change when it exists has been shown to be a predictive factor for stock selection in a portfolio.

Using previous academic research as a guide (Lazy Prices), SMA has shown the predictive nature inherent in changes in regulatory filings. The results presented in this paper show how multiple factors tend to predict future returns in securities and can be a factor for stock selection in a portfolio.

The flexibility of the raw data provided allows subscribers to create an infinite number of derivative factors at the Item, Part, and Total Document level. These factors will continue to be explored as an additional source of alpha.

Although this analysis only included factors at the Total Document level, the Management Discussion & Analysis section, and Risk Factors section, other sections within regulatory filings can provide additional insights into a security’s future return. Furthermore, we expect additional insights to be uncovered using natural language processing to quantify the sentiment of the underlying text at the various levels of the document. These analyses and more will be explored by Social Market Analytics and S&P Global in the future.

Coinmetrics

Coin Metrics and Social Market Analytics (SMA) announced today a partnership to incorporate SMA’s Crypto Currency Data Feed into the Coin Metrics Market Data Platform.

Alternative data such as social media platforms and data feeds have become a vital source of information for traders, particularly in the Crypto Currency Markets. The SMA Crypto Currency Sentiment Feed will offer the Crypto Currency community a tool for including social media sentiment data in their trading and portfolio strategies and expand Coin Metrics market leading Crypto Asset market and network data products.

“As the Crypto Investing market continues to mature, institutional investors are demanding data from trusted partners. These institutions are looking to make data-driven decision by accessing sources of data that they understand from their legacy investing frameworks. We believe that the power of combining sentiment data with granular network and market data is fundamental to building a deeper understanding of crypto assets. Coin Metrics is excited to partner with SMA, who has a long history of providing sentiment data to traditional capital markets participants and share Coin Metrics’ principles and values. The ability to provide an all-in-one Crypto Financial Data solution is a huge convenience for institutions.” Comments Tim Rice Co-Founder and CEO of Coin Metrics.

“Artificial intelligence and Natural Language Processing are moving into our everyday lives at light speed, and perhaps into financial markets even faster than that. We feel strongly at SMA that participants in Crypto Currency markets will benefit from our unique process in this emerging field, both in its approach to filtering social media data and in the analytical methodology used to develop our proprietary metrics. We’re excited to partner with the Coin Metrics team to offer this service through a versatile industry leading platform” said Joe Gits, Co-Founder and CEO of SMA.

About Coin Metrics

Coin Metrics was founded in 2017 as an open-source project to provide the public with actionable and transparent network data. Today, Coin Metrics delivers market and network data, analytics and research to its community and wider industry. https://coinmetrics.io/

About Social Market Analytics, Inc.
Social Market Analytics quantifies social media data for traders, portfolio managers, hedge funds and risk managers using patent pending technology to detect abnormally positive or negative changes in investor sentiment. SMA produces a family of quantitative metrics, called S-Factors™, designed to capture the signature of financial market sentiment. SMA applies these metrics to data captured from social media sources to estimate sentiment for indices, sectors, and individual securities. A time series of these measurements is produced daily and on intraday time scales. For more information, including a User Guide to S-Factors™, please visit www.socialmarketanalytics.com

Social Market Analytics aggregates the intentions of professional investors as expressed on Twitter.  SMA factors are highly predictive over various time frames.  In June of 2017 Social Market Analytics launched a weekly re-balanced large cap sentiment based index.  This index is comprised of twenty-five stocks with the highest average Twitter sentiment over the prior week selected and re-balanced Friday afternoons from the CBOE Large Cap 450 Index.  This index has been published daily since that date and is available on all major feeds.

Last year the SP500 Index had a return of -8.4%.  The CBOE SMLC Index had a return of +.87%.  Below is a comparative return chart over the last year compared to the SP500.

For more information or to license this index please contact us at ContactUs@SocialMarketAnalytics.com

smlcw performance


Social Market Analytics (SMA) tracks real-time sentiment on equities, commodities, currencies, ETF’s and crypto currencies.  SMA has the most powerful and customizable Alerting API combining Twitter sentiment and pricing metrics.  Users receive custom real-time sentiment alerts on instruments in their watch list.  For example, on December 11, 2018, SMA’s alerting system sent an alert on Corn at 12:12 pm CT when corn was @ $385.25. Below is the email and mobile alert.

Cornalert

Mobile

Subsequent to the alert, corn moved lower starting at 12:17pm CT. The price continued to move lower the remainder of the day and closed at $383.25. (See chart below)

Corn Alert

The above alert was based on SMA’s rolling 24-hour sentiment. SMA also calculates a Long-term sentiment with longer price projection periods.  Corn’s long-term S-Factor flipped from positive to negative on November 14th. 12/10 was the first day the long-term S-Factor for corn reached a significantly negative level of -1.5 standard deviations more negative than the longer-term baseline conversation. For more information please contactUs@SocialMarketAnalytics.com

This year has been tough for most investment strategies.  Firms using traditional sources of data are generating the same underwhelming returns.  Two years ago, Social Market Analytics, Inc.  (SMA)  (Twitter)   launched the SMLCW index in partnership with the CBOE.  This index is re-balanced weekly and comprised of the twenty-five securities selected from the CBOE large cap universe with the highest average S-Score over the prior week.  It’s A long only index of super-cap stocks with unusually positive Twitter conversations.

SMA publishes a family of metrics providing a full representation of the Twitter conversation across equities (US and LSE), commodities, currencies, ETF’s & Cryptos.

S-Score is a normalized representation of the current Twitter conversation of professional investors as identified by Social Market Analytics patented algorithms.  SMA has access to the full Twitter feed through our licensed partnership with Twitter and listens in real-time for any mention of topics and securities of interest.  These Tweets are scanned in real-time for sentiment and influence of the poster and compared to prior conversations over the look back period.  Securities with higher S-Scores subsequently outperform and securities with negative S-Scores under-perform.

SMA S-Scores are predictive over multiple prediction periods.  With seven years of out-of-sample data we can extend our comparison baselines and predict over longer periods.

Year-To-Date the SMLCW index is up over 7.5% while the SP500 is flat.  Subtracting a couple percent for commissions/slippage and the index is still significantly positive. This is not a back-test, this index has been live and on your quote screens for nearly two years.  YTD actual performance chart from the CBOE site is below.

SMLCW - YTD

As mentioned, this is a long only index.  During the recent market drawdown this long index has been performing.  SMA negative S-Score stocks have been moving lower at a significant rate – generating positive alpha.  Below is a chart of the SMLCW index compared to the SP500.  for any questions or to learn more please contact us at:  ContactUs@SocialMarketAnalytics.com.

Thanks,

Joe


Social Market Analytics (SMA) publishes real time Twitter based sentiment for nearly 300 crypto currencies including Bitcoin.  To view Bitcoin sentiment values and 35 other commodities in real time, go to the CME Active Traders website.   Twitter based sentiment has proven to be strongly predictive for Bitcoin and other commodities.

Today we will review a sentiment-based Z-Score strategy to generate profitable trades for Bitcoin.  This is similar to traditional standard deviation band strategies calculated with price.

When Twitter volume from certified investors is abnormally high use the sentiment of the abnormally large conversation to select entry points.  Strategy overview is below:

CMEBitcoin 1

A visualization of the strategy is below. When the Z-Score of Social Market Analytics Indicative Twitter volume is greater than the threshold and the tone of the conversation is significant enter or modify trades.  Sentiment  > 2 standard deviations and the volume of the conversation is high enter a position.  Positions are modified based on further extensions of the Z-Score.

CMEBitcoin2

Test period is from 1/1/2017 to current.  Overall results below.  For more detailed results on this and other strategies contact ContactUS@SocialMarketAnalytics.com

CMEBitcoin3

SMA has examples of profitable applications of Twitter based sentiment to many coins.

Social Market Analytics (SMA) data is live on the CME Active Trader Website.  Real-time sentiment and indicative Twitter volume is used by traders to generate new ideas.  Sentiment data is predictive across various time frames.  High sentiment commodities go on to outperform and negative sentiment commodities underperform.  SMA covers 36 commodities on the CME website for: Agricultural, Equity Indexes, Energy, Metals, Interest Rates & FX.

On Monday 9/24 Gold Sentiment crossed through extreme positive at 7:30 am central time.    https://activetrader.cmegroup.com/Products/Metals

GoldBlog1

Clicking on the chart expands the time frame for further analysis.

GoldBlog2

To learn more about Social Market analytics commodity sentiment data or more about the CME implementation: ContactUs@SocialMarketAnaltics.com.

To receive alerts like this in real time follow us on Twitter at @sma_alpha.