Posts

Every year Social Market Analytics (SMA) is proud to work with the University of Illinois Masters of Science in Financial Engineering Students on a practicum project. In the past we have explored looking at sentiment to predict the VIX, enhancements to traditional indexes and smart beta ETF’s. This year we decided to tackle the most popular topic of the last year – Bitcoin Trading!   We worked with RCM Capital’s Strategy Studio Platform for back testing to develop a Bitcoin trading strategy combining price momentum with sentiment to keep you in the market when Bitcoin is trading up and minimizing draw downs when Bitcoin retreats as it did in early 2018.

Social Market Analytics tracks sentiment on the top 275 market cap currencies, the below Bitcoin strategy performs similarly on other Crypto currencies.

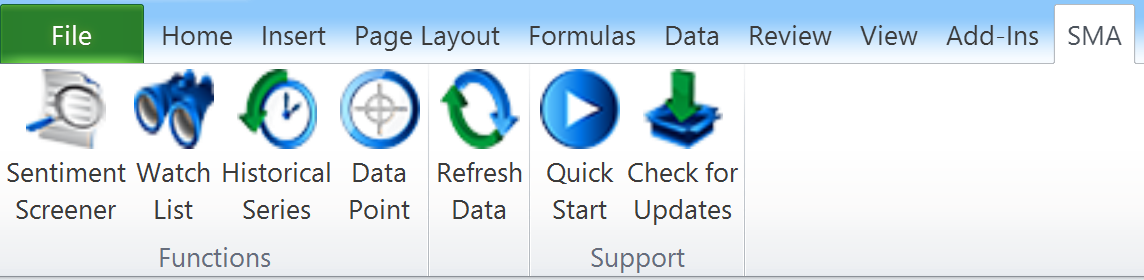
The students did a wonderful job in strategy construction and explanation.  I will undoubtedly leave something important out.  ContactUs@SocialMarketAnalytics.com for details.

At it’s core the strategy buys on a price breakout with a sentiment confirmation.  Exit when price breaks down and is confirmed with sentiment.  Buy when the price crosses above (K) standard deviations over a 21 day moving average of price.  Variable K ranged from .5 to 2. Results shown use a .5 standard deviation multiplier.  Strategy visualization is below.

BitcoinStrategyVisual

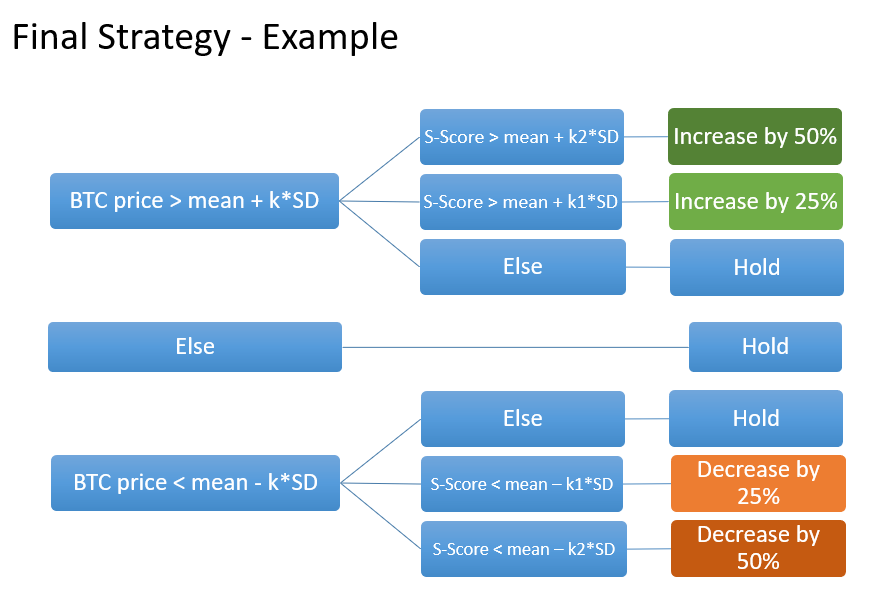
Your first trigger is a breakout above K- Standard deviations of the 21 day moving average.

The confirming signal is based on the Social Market analytics S-Score value.  S-Score is a normalized representation of Bitcoin’s Sentiment time series over a look back period and is updated every minute.  It measures the tone of the conversation on Twitter relative to the benchmark time period.  If Bitcoin is breaking out and the sentiment is 2 standard deviations more positive than normal you initiate or add to your position by 50%.  If the conversation is 1 standard deviation more positive than normal  increase the position 25%.  If the standard deviation price break out is not confirmed by sentiment then no position change.

There was no short position initiated with futures.  Exit criteria are opposite entry criteria.  Price break below K – Standard deviations below a moving average. Confirmation with S-Score.

BitcoinResults

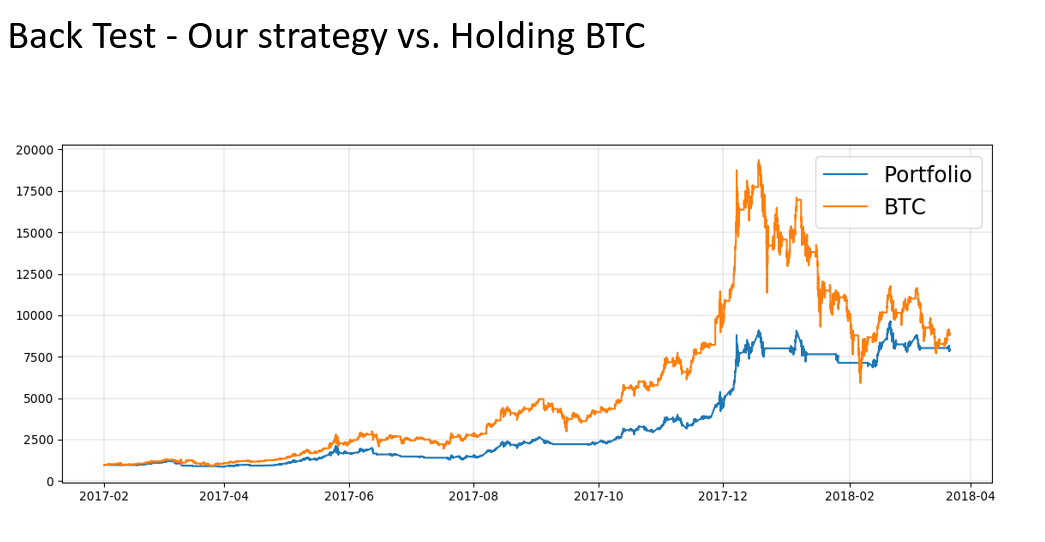
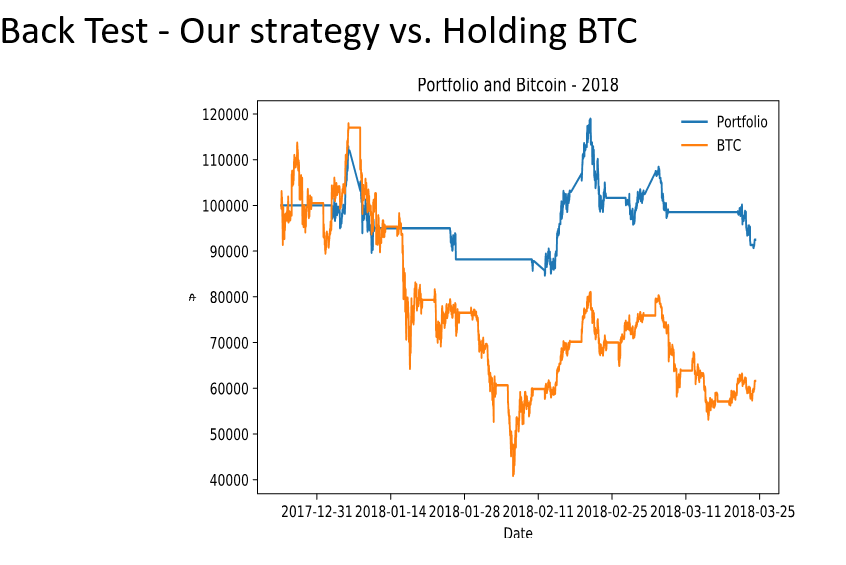
Dollar P/L results indicated this portfolio successfully navigates the the bitcoin draw down of early 2018.   2018 in isolation is below.

Bitcoin-2018

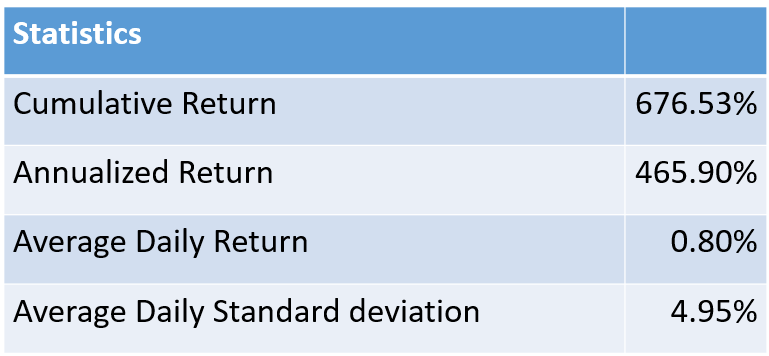
Overall performance with Buy & Hold Bitcoin comparison.

BitcoinStats.png

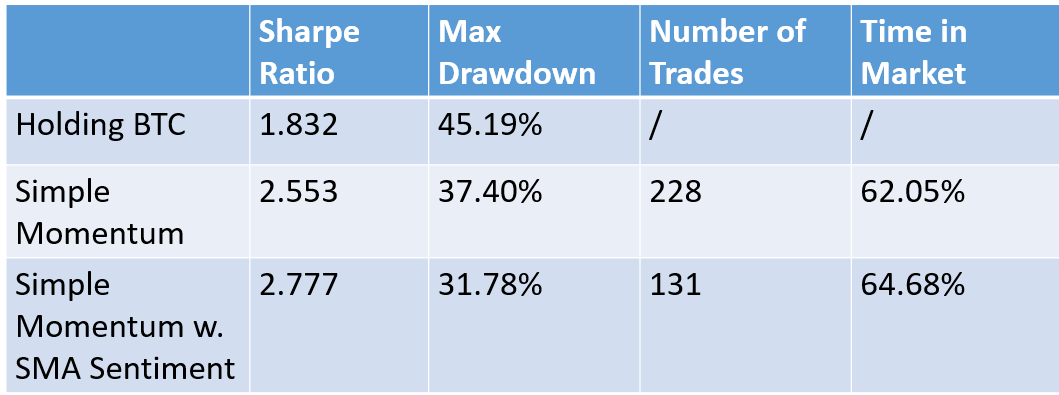
Sharpe ratio and draw down improve dramatically with the momentum and sentiment confirmation.

stats2

Again, please ContactUs@SocialMarketAnalytics.com for more information on our offerings.

Thanks again to the University of Illinois MSFE students and RCM  Capital Markets for contributing to this project.

Regards,

Joe


Social Market Analytics, Inc. (SMA) is celebrating six years of out-of-sample data in US Equities.   This data is unique in that it is a true representation of the Twitter conversation at each historical point-in-time.

Since our launch, SMA has become a leader in providing sentiment data feeds to the financial community.  Our data has become an integral part of our customers investment process.  Our customers are Quantitative Trading Firms, Hedge Funds, Sell Side Brokers, Traders and many others. SMA data is suitable for HFT, Quantitative Trading, Risk, Short Lending, Smart Beta, Fama-French Models, VAR among others.  Predictive signals range from a few minutes to quarterly.

SMA’s analytics generate high-signal data streams based on the intentions of market professionals.  Our patented machine learning process has produced six years of strongly predictive data as illustrated in the chart below.  This chart illustrates the subsequent performance of stocks based on pre-market open (9:10 am Eastern) sentiment scores.  Stocks with high sentiment subsequently out perform as illustrated by the Green line.  Stocks with strong negative sentiment go on to under perform as evidenced by the red line.  The blue line represents a theoretical equally weighted long short portfolio.  The table below illustrates Sharpe and Sortino ratios.


Fullhistory

Joe Gits, CEO of Social Market Analytics, recently spoke at the 34th annual CBOE Risk Management Conference.

Gits spoke at RMC about SMA’s patented technology, the Social Sentiment Engine, and Twitter’s relevance in financial markets.

Hosted by the Chicago Board Options Exchange, the RMC is an educational forum dedicated to exploring the latest products, trading strategies and tactics used to manage risk exposure and enhance yields. The RMC is the foremost financial industry conference designed for institutional users of equity derivatives and volatility products.


Social media beats the mainstream media on a regular basis.  Last week social media beat the news wire in reporting the MSFT acquisition of LNKD (blog post below) and Tuesday Twitter broke SCTY being acquired by TSLA.  This information is not theoretical – it is actionable data in our feed!

Tesla Motors lit up Twitter, yesterday, when CEO, Elon Musk came out and said their cars can float on water.  Tuesday June 21, the electric car manufacturer took everyone by surprise when they announced their decision to buy the solar panel company SolarCity (SCTY) minutes after the markets closed. The first news article to mention this came out at 4:18 PM CDT. Twitter had already gotten wind of this development 8 minutes prior with a tweet from the account “TopstepTrader”.

TSLA -SCTY

The tweet from “TopstepTrader” was deemed to be credible by Social Market Analytics’ sophisticated algorithm, which separates signal from noise to create actionable intelligence. The sentiment started to move in a positive direction the very next minute. By 16:12 CDT, SMA’s subscribers received ‘S-DeltaTM’ alerts on SCTY. The PredictiveSignalTM from SMA became positive at 16:13 CDT and at 16:18, when the first news article came out, the sentiment had already reached an extremely positive level, with Tweet volume soaring high; as was the stock price. Traders who incorporated social media sentiment from SMA into their trading models were ahead of the curve, making profits as the rest of the market was just learning of the news.

SCTY

The S-Delta metric also flagged this move.  The below chart illustrates the delta values for SCTY.  Delta represents the change in S-Score over a 15 minute lookback.  Delta values of 2 or higher are huge outliers. An SMA alarm based on Delta or S-Score would have provided an alert to this breaking news.

SCTY_Delta

To find out how you can use SMA S-Factors in your investment process contact us at Info@SocialMarketAnalytics.com


As is the case with most corporate events now, MSFT buying LNKD broke on Twitter first. The very first mention of this is any news article was at 7:38 AM (CDT) but Social Market Analytics (SMA) detected this 7 minutes ahead at 7:31. SMA’s patented algorithm digests, filters and evaluates Tweets in real time. The filtering process, a proprietary Tweet account filtering technology built by SMA, separates signal from noise by continuously scanning for accounts that are deemed credible to be included in the calculation process. The tweets from spam accounts are filtered right away.

The following are the 5 tweets that SMA received from these credible accounts in a matter of 13 seconds. All of them pointing towards the same positive news.

Tweets

The 7:32 AM sentiment, as a result, had already started moving positive. By the next minute, at 7:33 AM the sentiment was already positive and soaring up. By the time other news sources caught up to this news, at 7:38 AM, the sentiment was already very positive. The S-DeltaTM alerts which measures the 15 minute changes in the sentiment had started firing up at 7:33 AM as people took notice of this and the Tweet volume kept soaring.

SentimentVisuals

Contact SMA for more information about using Twitter based metrics in your investment process: info@SocialMarketAnalytics.com


Social Market Analytics (SMA) aggregates the intentions of  investors as expressed on the StockTwits platform.   SMA creates proprietary S-Factor metrics that quantitatively describe the current conversation relative to historical benchmarks.  This data provides strong predictors of future price movement.  This blog will focus on the deterministic nature of the StockTwits data set when aggregated into SMA S-Factors.    StockTwits is a community for active traders to share ideas enabling you to tap into the pulse of the market:  http://stocktwits.com/

The charts and tables below illustrate the subsequent open to close return of stocks that are being spoken about abnormally positively or abnormally negatively on StockTwits twenty minutes prior to market open.  Sharpe and Sortino ratios for the theoretical portfolios are included as well.  The SMA S-Score looks at the current conversation relative to historical benchmarks and creates effectively a Z-Score.

The Green line below is an index of subsequent open to close return of stocks with abnormally positive conversations on StockTwits prior to the market open.  The Red line is an index of the subsequent open to close return of stocks with an abnormally negative conversation prior to market open.  The black line represents the market open to close return and the blue line represents a theoretical long/short portfolio.

These charts clearly illustrate the predictive information present in the StockTwits message stream. If there was no predictive power in the StockTwits data set the Green, Red, and Black lines would be nearly identical -statistically not the case.  These signals are available at 9:10 am Eastern time well before the market open.

The chart below looks at the full SMA history of StockTwits based S-Factors.  The theoretical long portfolio has a Sharpe Ratio of 1.53, theoretical short portfolio -.82 Sharpe and LS portfolio has a Sharpe of 3.68.   Sortino Ratios are above one as well.  There is strong predictive power in this data.

FullHistoryStockTwits

The last year has been particularly challenging for the Hedge Fund community.  Below is a chart with the performance of the theoretical portfolios broken out from 1/1/2015 to current.  As you can see these portfolios performed well in this volatile market period.

LastYearStockTwits

For more information on these data sets please contact Pierce Crosby:  (pierce@stocktwits.com)  or Joe Gits: (joeg@socialmarketanalytics.com)

Regards,

Joe

Wow, what a ride 2015 was with the S&P 500 closing slightly down for the year.  As we head into 2016 are you going to continue to look at the same factors as everyone else or maybe try something new?

Below are the returns for stocks with significantly positive and negative pre-market open S-Scores.   Stocks with High pre-market open sentiment scores had a cumulative return of 12.19% versus an SP 500 open to close return of -.38%.  Stocks with a low pre-market open sentiment score had a cumulative open to close performance of -34%.  Stocks with high sentiment scores outperformed and stocks with low sentiment scores under-performed.  With significant Sharpes and Sortinos.  Combining S-Factors with your selection criteria and risk management can add a dynamic new factor to your security selection.

These charts use the S-Factor S-Score.  SMA publishes and family of S-Factors  to clearly identify the tone of the social media conversation.  To learn more go to: https://socialmarketanalytics.com/process.

returns2015


Returns2015Tables

Returns2015FullHistory

Returns2015FullHistoryTable

Social Market Analytics has been publishing the performance characteristics of stocks with high and low sentiment over the last four years.  Last year it was difficult to find success with traditional factors.  SMA S-Factors helped our customers generate out-performance.   Please contact Social Market Analytics to explore how sentiment based factors can be included in your models: ContactUs@SocialMarketAnalytics.com.


Smart Beta Sentiment Enhanced ETF Performance Analysis

At SMA we continuously research our data.  Below we discuss modifying weights of the SPDR SPY ETF based on sentiment values and examine the impact on return.  Please contact SMA (info@SocialMarketAnalytics.com) to learn more.

The SPDR SPY ETF is a cap-weighted ETF which closely replicates the performance of the S&P 500. Our objective is to develop a “smart beta” strategy using the social media sentiment levels of individuals ETF constituents and amplify or accentuate the weights of the constituents in the ETF while keeping the Assets under Management constant. The transaction cost assumption is ignored for both the original and the enhanced ETF.

One of the strategies explored was looking at the sentiment levels an hour before the close (2:55 PM Eastern Time) and re-balancing the weights according to that. The stocks were bought or sold (to reduce position as per new weight only, NO short selling) at the close of the day and the positions were maintained until the next day when the re-balancing was performed again. To explore the weight modification methodology please contact SMA.

Our re-balance strategy keeps the AUM constant with no need for additional funds. Another strategy explored was to use a “lagged” sentiment. The lag being a day. So, for adjusting the weights today, we looked at the sentiment at 2:55 PM yesterday, and changed the positions based on that.

The results for the cumulative returns calculated over the period extending 7/31/2013-8/31/2015 are summarized below.  Chart 1 shows the cumulative returns over the period for the “Original” which calculates fund returns using positions and closing price data. The “500% PM” makes the calculations using enhanced weights based on the pre-close sentiment. The “500% PM Lagged” has enhanced performance using pre-close sentiment from previous (trading) day.

Chart 2 shows the cumulative out performance, for the 2 “smart beta” strategies.  As you can see both strategies track the SPDR SPY ETF while outperforming performance.  You see the benefit of adding sentiment to your calculation process without increasing risk.

Chart1

Chart2

This is preliminary research we will be enhancing and updating over the coming weeks.

Regards,

SMA

Social Market Analytics has been offering API access to our data since inception. Fewer people know we also offer powerful visualization and screening tools.  We offer two ways to access our data without programming.

First, we have a robust Excel Add-in that allows for Real-Time screening and historical retrieval.  This functionality is ideal for integrating sentiment data into Excel based research platforms.  You can screen for user defined pricing and sentiment criteria or upload a watch list and monitor sentiment activity on these securities in real-time.

Add-In

The SMA Sentiment Dashboard is a real-time visual representation of sentiment changes for the entire universe or your watch list.  the below screen provides a real-time view of stocks with large changes is social media.  Users can set criteria for filtering for the most relevant securities.

Dashboard1

The dashboard tracks sentiment for Stocks, commodities, currencies, indexes, sectors and industries. Below is an illustration of industry level sentiment.

Industry

In, addition users can set screening criteria for real-time alerting by email, text or private Tweet.   Alerts can be specified for individual securities, watch list of securities or the entire universe.

ExistingAlerts

These are just some of the visualization tools SMA offers.  For a full demonstration of trial contact us at Sales@SocialMarketAnalytics.com

Thanks,

SMA

The chart below looks at the percentage of positive Tweets versus the percentage of negative Tweets over the last couple of weeks.  There are usually significantly more positive than negative Tweets so the fact that the negative percentage was so high is valuable data in itself.  As you can see the percentage of negative Tweets increased prior to days with significant market downtrends.

The black lines on the chart represent market activity.   The red and green bars represent negative and positive Tweet percentages.  Sentiment is captured by Social Market Analytics 24×7; you can see the growth in negative sentiment prior to the Monday (8/24 draw down).  On 8/24 the market started strong and fell significantly at session end.

The universe of Tweets is so large that when you aggregate it you get a terrific view of what people believe is going to happen.  This data is only available from Social Market Analytics.  Please contact us for more information on our market leading data sets or visit our Research Page.

PosNegTweets

Thanks,

Joe