Posts

Social media is a new and rich source of trading ideas.  To illustrate this point, below are some recent  trading opportunities social media data presented.  In each case activity and sentiment increase prior to the actual event.  Social media is a leading indicator of stock performance and SMA is the leader in providing metrics based on social media.

Teva acquires Allergen

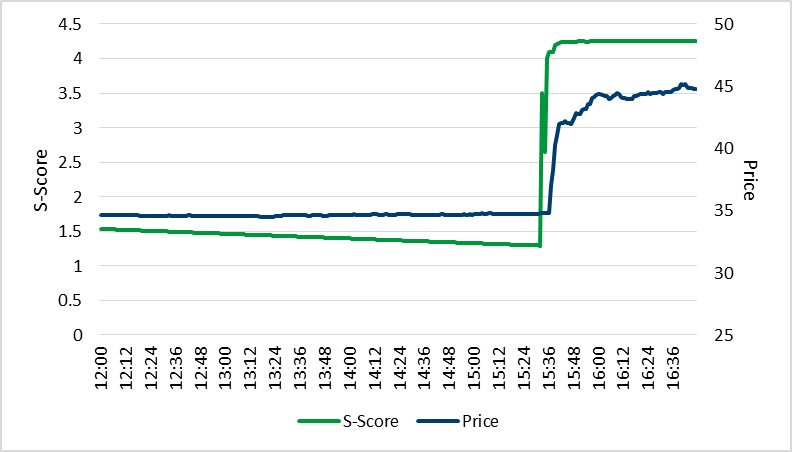
Teva Pharmaceutical Industries surged in pre-market trading on July 27, 2015 on news that the company will be acquiring Allergan’s (AGN) generic drug business. Before this happened, sentiment on Twitter had already become strongly positive. At 4:00 AM EDT, when the stock price was $66.00 there was significant positive sentiment on Twitter. The sentiment rapidly shifted positive. By 7:24 a.m., the stock was trading at $72.30. The stock opened at $67.80 when the sentiment was 3.92 and closed at $72.

Figure 1:  S-Score™ For TEVA Pre- and Post-Announcement.

TevaSentiment

TevaHistoricalSentiment

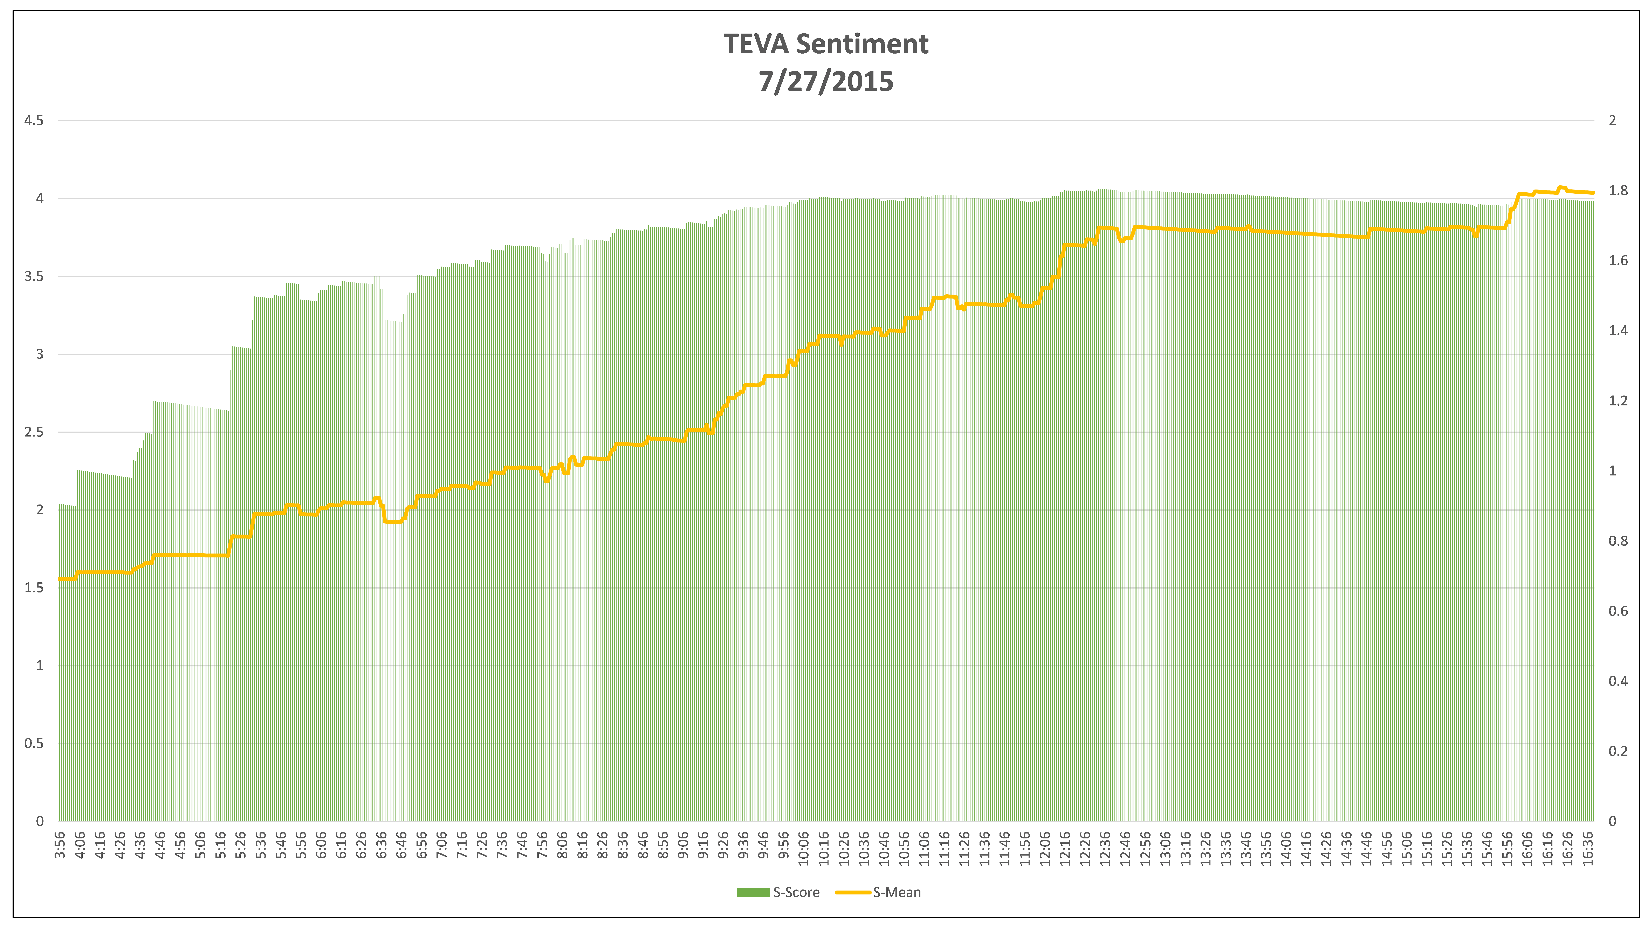
Historically, daily sentiment scores for TEVA fluctuated near 0 (Neutral), with low social media activity as indicated by the time series of the S-Volume™ metric.  This behavior started to change on July 26 with significant upticks in indicative Tweet volumes and sentiment levels.  On the morning of July 27th,TEVA’s S-Score™ increased sharply to a high positve level, coincident with a spike in S-Volume™ consistent with high social media activity, indicating that SMA’s processing technology had sucessfully detected the signature of positve sentiment for TEVA embedded in the Twitter data stream.  This high positive sentiment level persisted through the open on July 28th and then started to return to typical historical levels as the markets and social media fully integrated the effect of the announcement.

Rumored Announcement of Acquisition:  Twitter (TWTR)

On July 14, 2015 at 11:39 AM EDT, a rumor started spreading on Twitter about Twitter being acquired by Bloomberg.  At 11:40 AM, there was a Tweet from user ‘beckyhiu’ indicating that Bloomberg had offered $31 Billion to buy Twitter and that Twitter was considering the offer. This rumor caused the stock price to rise rapidly. A Tweet, about 30 seconds later, at 11.41 AM,  by ‘zerosum24’ confirmed that the rumor had reached Twitter and people had started talking about it. The sentiment had started rising rapidly by this time. The changes in S-ScoreTM and S-DeltaTM were significantly positive. At 11:42 AM, the sentiment was over 2, and was statistically significant.

It was soon realized this might be a hoax and that no offer was made. At 11:42 AM, ‘TurboResearch’ questioned the credibility of the buyout offer.

There had been no official statement from Bloomberg, and hence, both the sentiment and the stock price kept rising. At around 11:50 AM, a journalist from Bloomberg Tweeted that the news was a hoax and that it was not to be believed. At this point sentiment started declining as people starting tweeting negatively. The stock price dropped rapidly.  After that, there were mostly negative comments driven by the refuted rumor.  The figures below show SMA sentiment factors leading the stock price quite accurately.

TWTRSentimentPrice

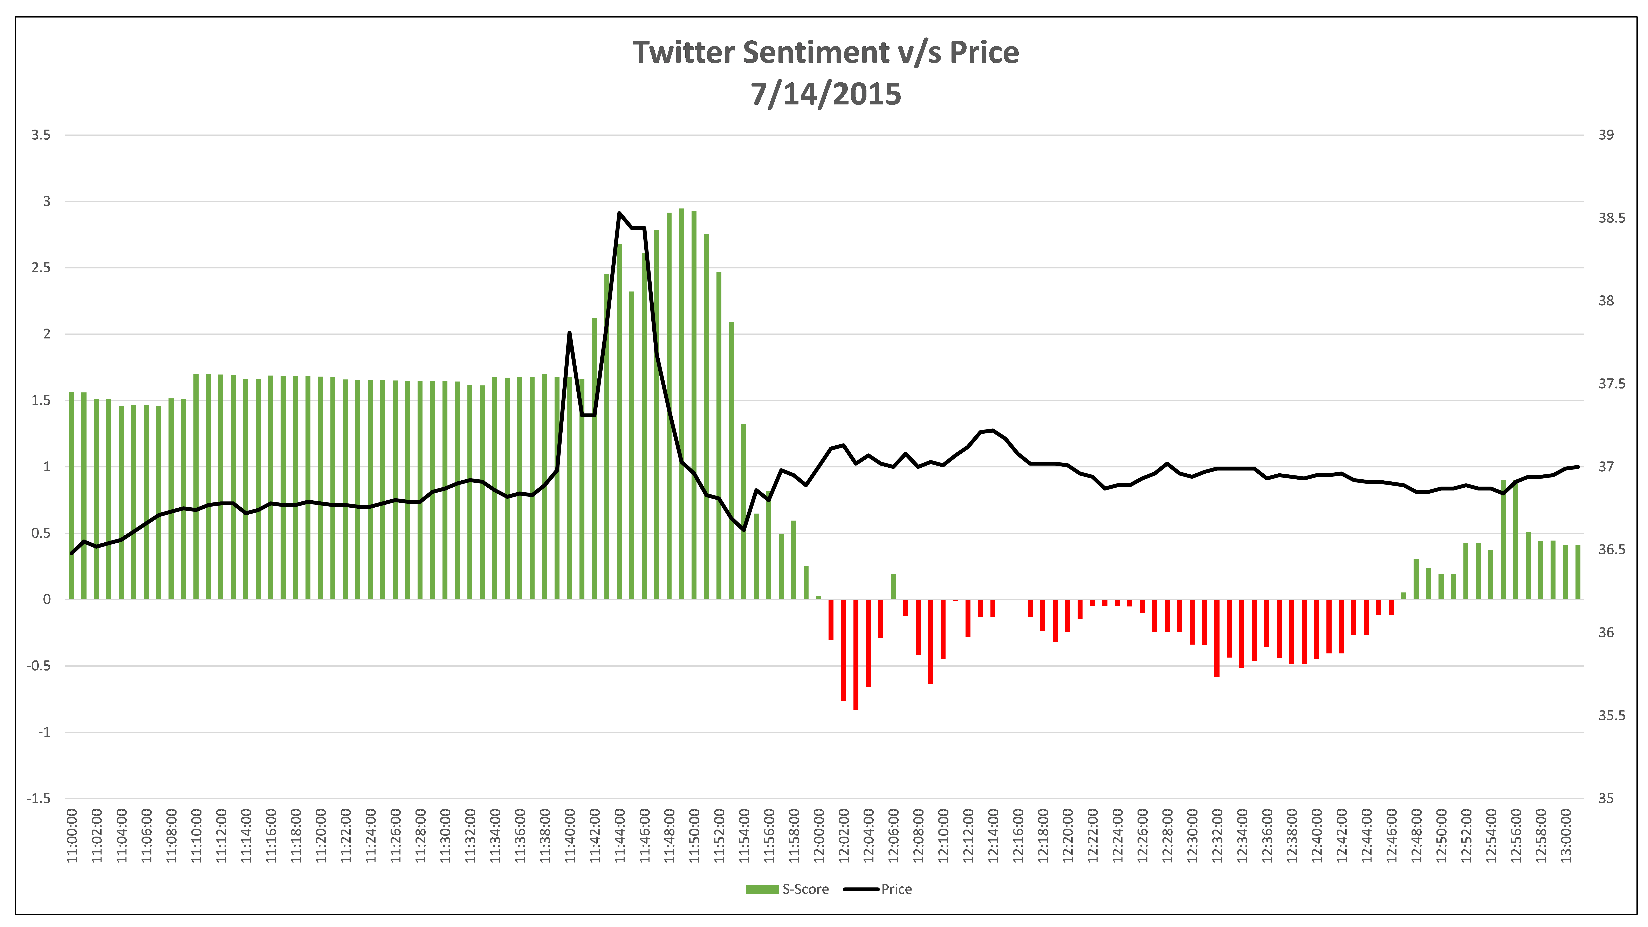
Figure 2: TWTR S-ScoreTM vs. Price

TwitterVolumeSpike

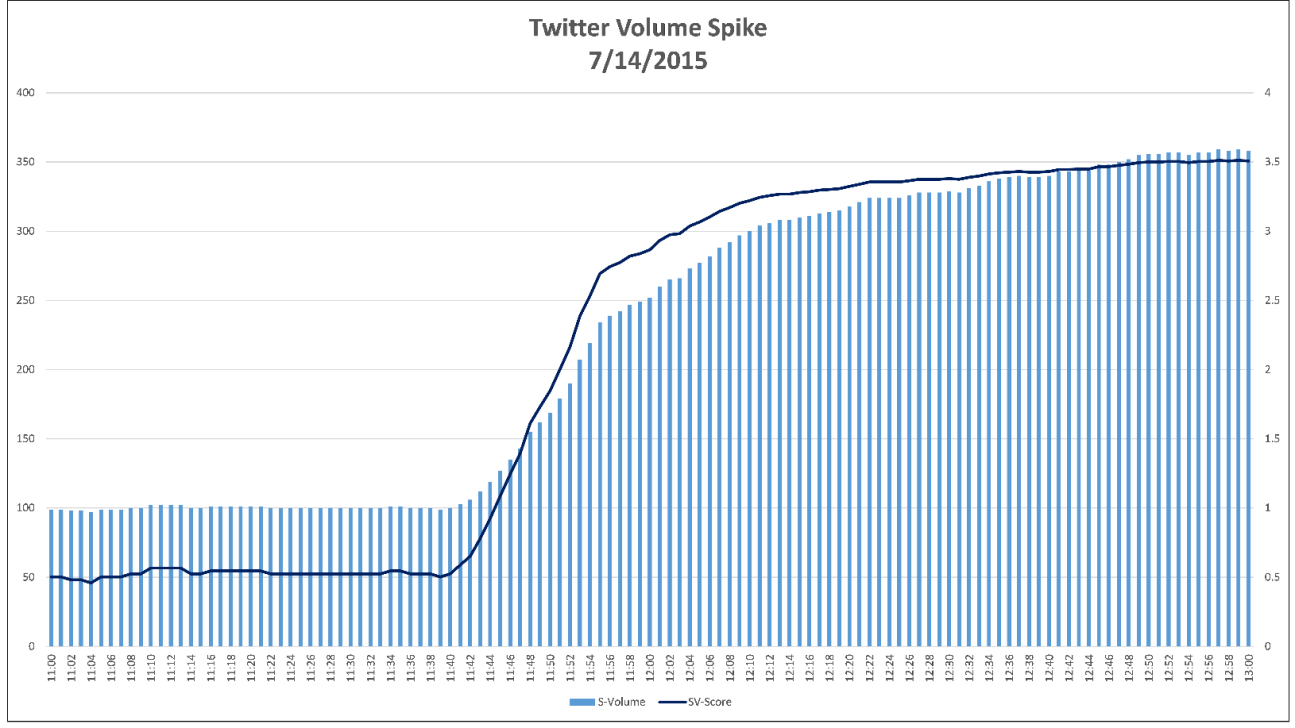
Figure 3:  Intraday   S-Volume™ Chart for TWTR

Amazon (AMZN) Earnings Announcement 

Twitter sentiment can predict stock changes even after market close, as in the case of Amazon. Amazon reported earnings on July 23, 2015. While the market consensus was that the company would not beat expectations, the conversation on social media was different.

SMA data showed a sharp increase in sentiment metrics around 2:49 PM EDT. By 2:51 PM, the sentiment on Amazon was two standard deviations higher than its typical level. The stock was trading at $480.45 at this point. At market close, it traded at $482.18, higher than the price at the time when sentiment on Amazon became positive.

It was interesting to see how the stock traded after-hours once the company reported earnings. Amazon’s stock shot up more than 17% — to $568 — from its price at 3:51 PM EDT after the company reported a surprise quarterly profit. The hidden sentiment value in Twitter data predicted what “conventional” market speculators failed to predict.

AmazonTweets

AmazonEarnings

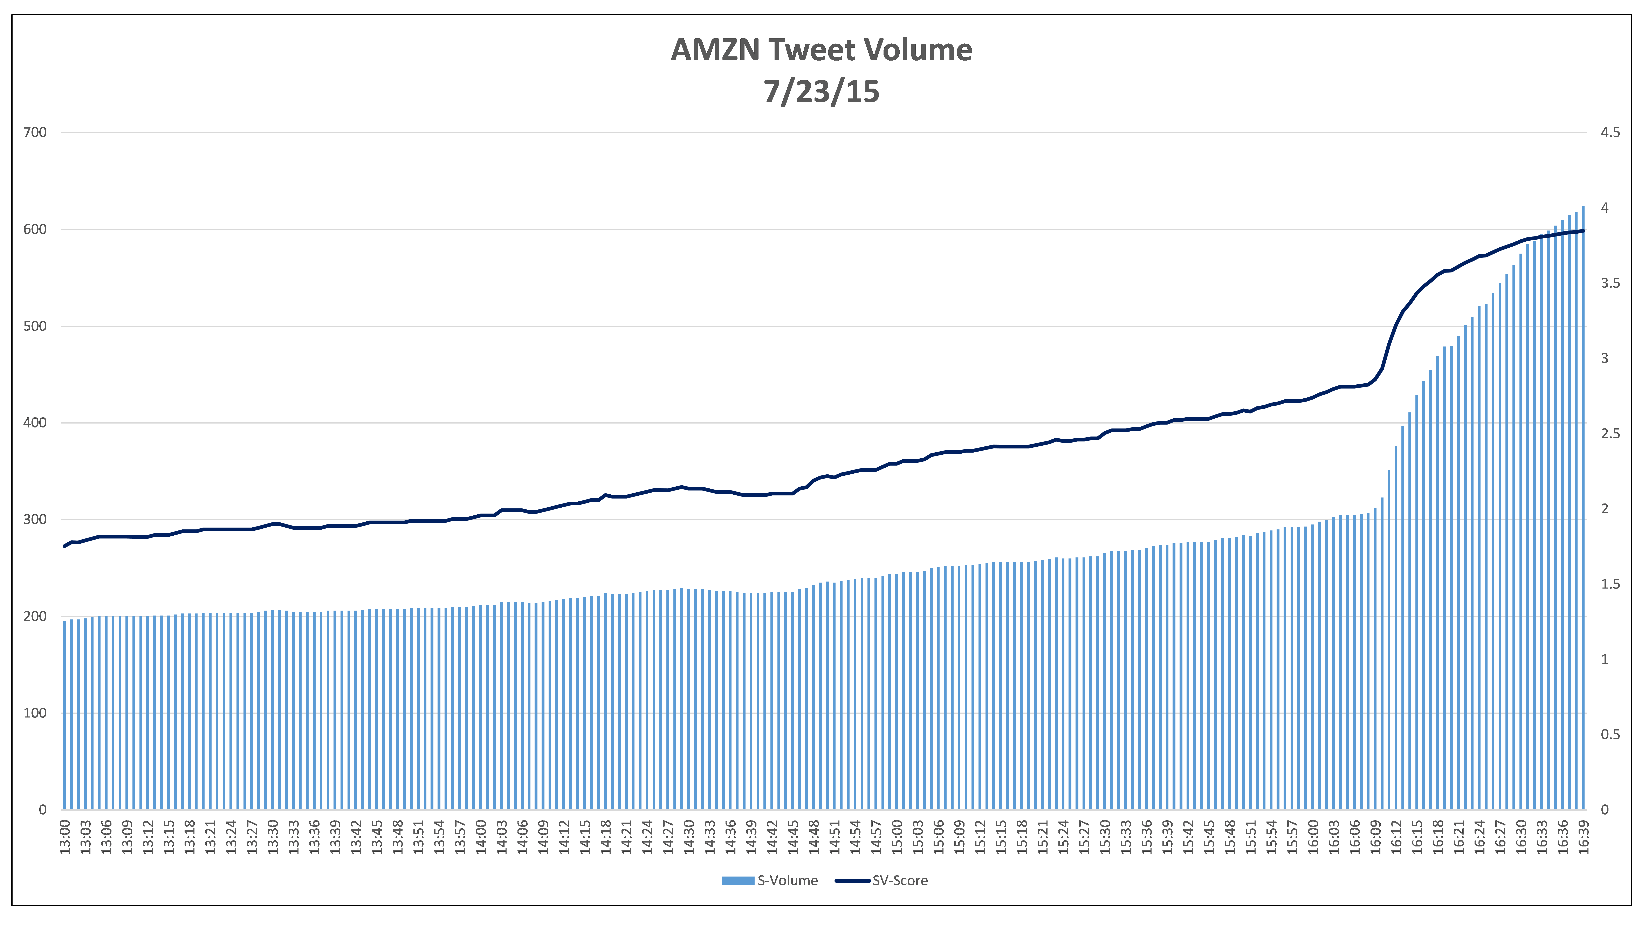
Figure 4:  Intraday S-Score™ And S-Volume™ Behavior across Amazon’s Earnings Event.

The progression of intraday S-Score™ and S-Volume™ metrics for Amazon is shown above from 1:00 PM EDT to 4:25 PM EDT.  Amazon’s sentiment remained positive throughout the day and became significant around 2:50 PM. The sentiment saw a sharp rise post the earnings announcement after market close.

We publish our own research and analysis.  We invite you to check our Research site for new updates and publications.

Thanks,

Joe

SMA has just completed a comprehensive analysis that shows the performance of classifier models, designed to predict next day directional movement for volatility indexes, improves by adding market sentiment measures derived from social media sources.  Please download the paper at:  https://socialmarketanalytics.com/research/white-papers

We present predictive models built from market data and S-Factors, a family of metrics designed to capture the signature of market sentiment as expressed in micro-blogging messages posted on Twitter. The objective of this report is to investigate the relationship between sentiment metrics generated by SMA and the volatility index of S&P 500 (VIX) and volatility indexes for individual equities (VXAPL, VXAZN, VXGS, VXGOG, and VXIBM), computed from equity option prices for AAPL, AMZN, GS, GOOG and IBM, respectively.

We used time series modelling and Logistic Regression as classifiers for predicting the direction of volatility. We tested the performance of the model with and without Sentiment Factor data. In our results, we found that the accuracy for predicting the direction of VIX using an ARIMAX-GARCH model with S-Factors was 70.86%. This was higher than the accuracy observed using a model that did not include the S-Factors (67.43%) . The same goes for most of the volatility indexes for individual equities that we picked.

Similarly, we compare the accuracy in predicting the probability of VIX going up the next day using a Logistics Regression model. The model that included S-Factors turned out to be more accurate than the model without S-Factor in all the volatility indexes for individual equities. The difference observed in accuracy was as high as almost 7.5% in the case of VXGS. The accuracy with S-factors was 62%, while without these factors it was just 54.67%.

Our analysis shows that the accuracy of a model increases by approximately 80% after adding SMA’s sentiment metrics to the model. Most of the investors are apprehensive of losses so they prefer a model that predicts the losses accurately. It is evident from our analysis that addition of S-Factors decreases the False Positive rate, thus predicting the downward movements of Volatility Indexes accurately.

Our results demonstrate enhanced predictive performance for models that include sentiment factors (S-Factors), using micro blogs like Twitter and StockTwits, as explanatory variables.

As usual, please contact us with any questions: ContactUs@SocialMarketAnalytics.com

Thanks,

Joe

Every quarter we review performance returns and statistical ratios for our family of S-Factors.   S-Score is a normalized representation of sentiment over a pre-defined look back period and is a key metric.  Below are some charts that look at the full history and YTD performance of our data across the entire universe.

Anyone can pick specific securities and instances where sentiment leads price movement; it’s a lot harder to consistently predict movements over the entire universe over a long period of time.  We pride ourselves on statistical consistency of our data over what is now 3.5 years of history.    We are the only company to track and publish these metrics, providing the most transparency.

We view S-Score >2 and S-Score <-2 as statistically significant.  An S-score of 2 means the current conversation on social media is more positive than 97 percent of prior conversations as filtered by our proprietary metrics.   When this happens the security moves higher with statistically significant consistency. The green line below represents the full history cumulative open to close return chart of stocks with a high S-Score (S-Score >2) prior to market open.  The Red line represents the full history cumulative open to close return of stocks with an extreme negative S-Score (S-Score <-2) prior to market open.  The black line represents the open to close return of stocks in the SP500.  The Sharpe and Sortino ratios for the green line (Pre-Open S-Score >2) are 1.37 and 2.23 respectively.  Sharpe and Sortino ratios for the red line (Pre-Open S-Score <-2) are -.54 and -.86. Benchmark SP500 Sharpe = .69 and Sortino = 1.08.

FullHistory

Below is the exact same chart for YTD 2015.  Sharpe and Sortino ratios show the benefit of our evolving filtering and scoring criteria.

returnYTD

SharpeYTD

Price and Tweet volume filters are commonly added when filtering stocks for sentiment.  Tweet volume represents indicative Tweet volume, once all Tweets are filtered indicative volume typically represents only 10% of the total volume of Tweets.  The below chart is the same return chart represented above with the added filter of Price day close price >5 and indicative Tweet volume > 5.  As you can see the Sharpe and Sortino ratios increase dramatically by adding simple filters.

PriceVolumeFilter

PriceFilterSort

Social media analytics is a learning process.  Our filtering and cleansing algorithms are continuously evolving.  We maintain our history as it was at each time and we keep dictionaries and accounts as a time series.

We have many more statistics employing other S-Factors and filtering criteria; please contact us for a more detailed briefing on SMA data and products.

Thanks,

Joe

SMA is an analytics company with unique IP for filtering and quantification of social media.   SMA to date has been primarily focused on the capital markets given our extensive knowledge of this industry.   On deck for us is the natural expansion of our capabilities to a “Topic Model” format.  Right now, we use our proprietary technology to filter and quantify the conversations around stocks, commodities and foreign exchange.  But the world cares about much more and we can help.

Early on we recognized the trans-formative value of Twitter as the next frontier for breaking and disseminating news.  Its high noise to signal ratio represented an opportunity for us to apply our knowledge to generate value.   We founded SMA in early 2012 to help people in the capital markets make sense of Twitter without having to weed through individual tweets.  We could see the explosive growth trajectory of tweets – now at 750 million a day – and realized it would soon become impossible to use traditional tools to really understand the market pulse around these social conversations.   We learned to convert the Twitter fire hose into real-time streams of high signal predictive data.  We also learned that the methodology used to generate these data streams let us filter the fire hose for specific conversations in very valuable ways.

First, we filter accounts for quality based on programmatic algorithms.  We started this process to eliminate the spammers, scammers and pump-and-dump schemers.   It’s a critical step in finding the quality information.  Even with this filtering, we current certify 65,000+ Twitter accounts for capital markets conversations alone, more than one person could reasonably manage to follow.   Each approved account is then rated and weighted, again diagrammatically.  This step is interesting for a Topic Model format in that you can certify accounts for different topics to create an expert stream of signals on any topic.

Next, we generate our S-Factor metrics.  SMA Dashboard Clients are familiar with our S-Factor Alerts.  Let’s talk about what these can really do.  Let’s say you’d like to track conversations on new products, but you really only need to know when the excitement is extremely high/low, rapidly turning negative, very volatile or going viral.  By building a list of custom alerts on your specified Topics, you get only what you want, when you want it.   If you want to know of the slightest hint of trouble, you can specify tight thresholds.  Or you can set your threshold levels much higher and only get notified of extremely unusual conversation trends.   You can then drill down to the individual tweet level to get more granular level content.  You can also search on individual tweet scores and view just those tweets with high/low scores.

SMA will send you an e-mail or text alert when your specified alert limits are hit.  You can also track all changes in real-time on the Dashboard. Of course, we still have our high-powered API and all of this capability can be directly integrated into any client system.  From the start, we designed our technology to be source and search agnostic and given client demand, we’ve added additional data sources.   As we start tackling the conversations outside of finance, we welcome your interest in new Topics.

By Kim Gits, CFO

There is a rapidly growing consensus in capital markets that rigorously analyzed information derived originally from social media can be a very valuable input in identifying trading opportunities. Nowhere was this more evident than in what happened to Altera shares on Friday, March 27th. Once news broke at 3:32 PM EDT in a Tweet by a respected Wall Street Journal reporter that Intel was in talks to buy Altera, share prices began to skyrocket…so much so that trading in Altera was halted after only three minutes at 3:35 PM. The story was highlighted in a number of places including The New York Post and CNBC: http://nypost.com/2015/04/02/wall-street-trader-makes-2-4m-thanks-to-a-tweet/ http://www.cnbc.com/id/102545580 But within that very short window a savvy options trader was able to put in a bid for 300,000 options on Altera at $36 per share. At the closing bell that Altera’s price was $44.39. The trader cleared just over $2.4 Million…not bad for an afternoon’s work. It is not clear what the exact mechanism was that enabled this trader to pull off such a spectacular trade….perhaps just great timing, perhaps using some sort of sophisticated model that incorporates input derived from conventional news sources and/or social media. But, what we know at Social Market Analytics (SMA) is that our analysis tracked this spectacular deal perfectly. SMA clients use our Sentiment (or S-) Factors as key inputs into the trading models they use. The graphic below illustrates what SMA analytics predicted what would happen.  Tweet time is central time.  Chart is based on Eastern time.  Our signal reacted well before the price move. Altera Tweet

The below chart overlays the SMA signal and price. Our SMA S-Score reacted significantly before the price changed happened.  Definitely time for SMA customers to act! SMA Signal and Price

This functionality is only available through SMA – Contact us for more details. Thanks, Joe