Posts

As regular SMA blog readers know we recently launched our first index with the CBOE.  The initial index (SMLC) is a daily rebalance portfolio based on the highest sentiment securities in the CBOE large cap universe.  Each morning we build a portfolio of the 25 highest sentiment securities and hold that portfolio to Close.   Back test and live performance have demonstrated the predictive power of sentiment data of a five-year period.

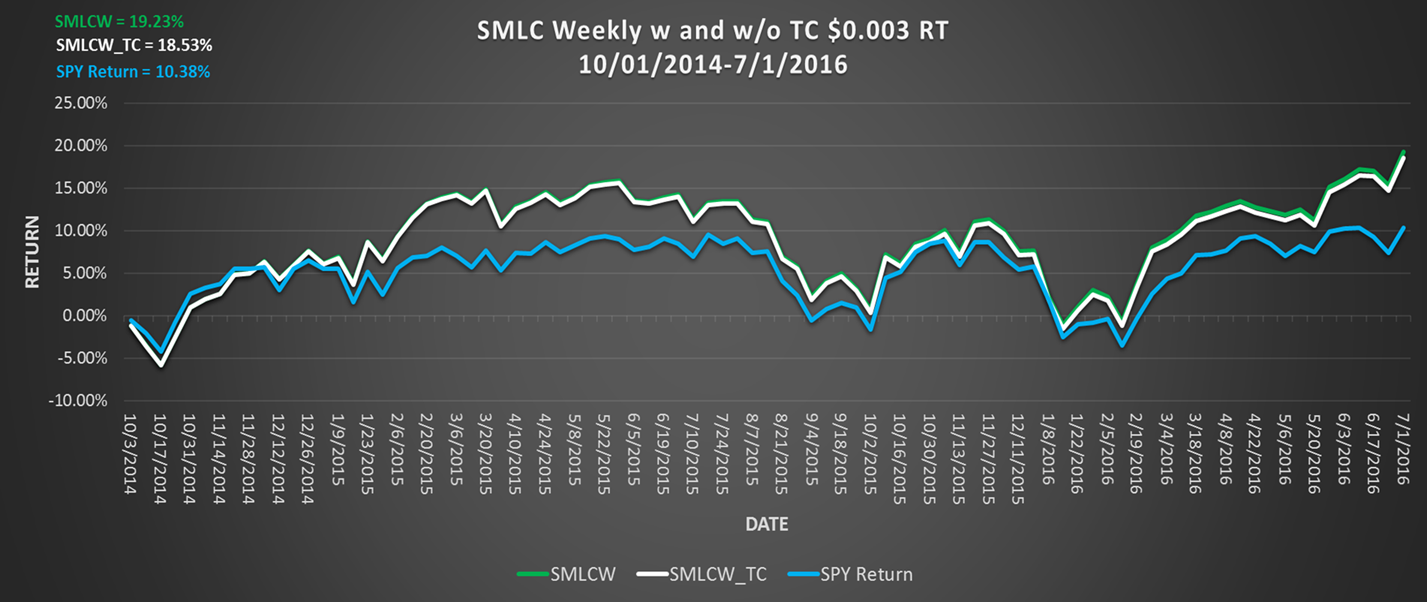
SMA and CBOE researchers have been working on multiple indexes, the next index (SMLCW) is a weekly rebalance portfolio based on the average sentiment of stocks during the week as measure on Friday mornings prior to the Open.  By averaging S-Scores, you generate a longer signal.  The subsequent portfolio is held for a week. The white line is portfolio performance post transaction cost.  As you can see from the chart the impact of transaction cost is minimal.

weeklychart

To learn about SMLCW or how rigoursly defined sentiment factors can help in your investment process please contact us.

Regards,

Joe

Signals derived from Twitter data have typically been viewed as shorter term signals.  There are a number of reasons for this.  One reason is the lack of out of sample data to back test trading systems on.  At SMA we now have nearly four and a half years of sentiment metrics to use in the creation of longer term signals.  Long-Term is a subjective term when discussing holding periods.  For our purposes we will be looking at trading signals that generate an average holding period of one month to three months.

At SMA we do not believe that one metric provides the full tone and context of a Twitter conversation.  That is why we publish a family of metrics call S-Factors that provide a richer view of the conversation than what is available with a single metric.

With history we have been able to look at longer term metrics and changes in security prices over longer periods.  We looked at large rapid negative changes in sentiment and determined that these sentiment movements are overreactions and lead to buying opportunities. We introduce two new metrics: Velocity and Acceleration.  The universes for these back test range from 20 large Twitter followed liquid stocks to the entire equity universe.  As you can see below these strategies identify solid buying opportunities and generate healthy average profit per share.  Please contact SMA to learn more about using sentiment to generate longer holding period trading signals with sentiment data.

Below are equity curves and trading statistics net of commissions with various universes. Overall you generate much fewer trades and hold them for longer periods of time.  The 50-day S-Score chart uses the SMA S-Score, Velocity and Acceleration Metrics.  You see that the holding periods are much longer than signals typically generated by social media.  The columns represent different universe sizes.

Slide1

200 Day S-Scores returns are below.  Again, please contact SMA for more detailed information.  Slide2

To learn more please contact us at: ContactUs@SocialMarketAnalytics.com

People ask about the persistence of SMA sentiment signals over time.   The signal length is dependent on the S-Factor used.   S-Mean for example represents a 20 day look back period and is generally used as a longer term signal.  We looked at a theoretical strategy using a universe of the Russell 1000 and S-Factors: S-Score, S-Volume and price.  It is not intended as a proposal of a trading strategy using S-Factors as a single factor in an alpha model it does illustrate the persistence of the signal over time.

We primarily looked at the signal prior to market open instead of prior days close to include the most recent social media conversation in the metrics.  If you use a sentiment score from the prior days close you don’t include overnight information such as news, foreign markets, and indication of market open…

The universe of stocks considered is the Russell 1000 representation as of 06/26/2015.  The back test period is 2011-12-01 to 2015-11-12.  There are no transaction costs/impact costs assumptions included in this analysis.

The simulation uses S-Score > 3 / S-Score < -3 AND S-Volume > 5 AND Price at Entry > $5.  An S-Score > 3 means the current conversation is more positive than 99% of conversations over the look back period (20 days).  The reason for choosing the threshold of 3 for S-Score is motivated, in part; on research results presented by Markit using the SMA S-Factors (contact us for the research).  The position holding period is Open to Close (+2), (i.e. close 2 business days from now).  The S-Factors signals used were selected at 09:10 AM (ET).

In the below chart, the Green Curve shows the results of going long on Positive Signal (S-Score positive with the thresholds used).  Similarly, the Red Curve shows the returns of the negative (S-Score <-3, negative return is good in this case). The Blue Curve is the result of going long on Positive Signal Portfolio and short the Negative Signal Portfolio each day.   Black Curve is the ONEK ETF (Russell 1000 SPDR ETF) and serves as a market reference for the back test period.  Risk adjusted performance measures (Sharpe, Sortino) and average daily returns are presented for each filter.

The results of Open to Close (+2) Strategy using |S-Score|> 3 & S-Volume > 5 & Entry Price > $5 signal at 09:10 AM are below.  To test the strength of a signal with strong threshold, we decided to hold the position for 3 days, (buying at the open when the signal met requirements of the filter and selling it at the close 2 business days later).  If a stock appears on 2 consecutive days, the trades are made in isolation, irrespective of the position that is held due to previous signal. The Positive and Long Short outperform the ONEK benchmark.  A large spread between Positive results and the benchmark is evident.

In our simulation the positive S-Score portfolio returns 23 bps per day versus the benchmark of 9 bps per day.  The long/short portfolio returns 28 bps versus the 9 bps per day for the benchmark.  Certainly significant reason for further analysis of adding sentiment signals to your portfolio.

These results illustrate that adding S-Volume and price filters, in conjunction with S-Score, yields significant positive returns performance.

Please contact us for much more detail and other back test or to explore how sentiment metrics can be used in your environment.

R1000 S-Score

RtnsTable

Social Market Analytics has been offering API access to our data since inception. Fewer people know we also offer powerful visualization and screening tools.  We offer two ways to access our data without programming.

First, we have a robust Excel Add-in that allows for Real-Time screening and historical retrieval.  This functionality is ideal for integrating sentiment data into Excel based research platforms.  You can screen for user defined pricing and sentiment criteria or upload a watch list and monitor sentiment activity on these securities in real-time.

Add-In

The SMA Sentiment Dashboard is a real-time visual representation of sentiment changes for the entire universe or your watch list.  the below screen provides a real-time view of stocks with large changes is social media.  Users can set criteria for filtering for the most relevant securities.

Dashboard1

The dashboard tracks sentiment for Stocks, commodities, currencies, indexes, sectors and industries. Below is an illustration of industry level sentiment.

Industry

In, addition users can set screening criteria for real-time alerting by email, text or private Tweet.   Alerts can be specified for individual securities, watch list of securities or the entire universe.

ExistingAlerts

These are just some of the visualization tools SMA offers.  For a full demonstration of trial contact us at Sales@SocialMarketAnalytics.com

Thanks,

SMA

SMA has just completed a comprehensive analysis that shows the performance of classifier models, designed to predict next day directional movement for volatility indexes, improves by adding market sentiment measures derived from social media sources.  Please download the paper at:  https://socialmarketanalytics.com/research/white-papers

We present predictive models built from market data and S-Factors, a family of metrics designed to capture the signature of market sentiment as expressed in micro-blogging messages posted on Twitter. The objective of this report is to investigate the relationship between sentiment metrics generated by SMA and the volatility index of S&P 500 (VIX) and volatility indexes for individual equities (VXAPL, VXAZN, VXGS, VXGOG, and VXIBM), computed from equity option prices for AAPL, AMZN, GS, GOOG and IBM, respectively.

We used time series modelling and Logistic Regression as classifiers for predicting the direction of volatility. We tested the performance of the model with and without Sentiment Factor data. In our results, we found that the accuracy for predicting the direction of VIX using an ARIMAX-GARCH model with S-Factors was 70.86%. This was higher than the accuracy observed using a model that did not include the S-Factors (67.43%) . The same goes for most of the volatility indexes for individual equities that we picked.

Similarly, we compare the accuracy in predicting the probability of VIX going up the next day using a Logistics Regression model. The model that included S-Factors turned out to be more accurate than the model without S-Factor in all the volatility indexes for individual equities. The difference observed in accuracy was as high as almost 7.5% in the case of VXGS. The accuracy with S-factors was 62%, while without these factors it was just 54.67%.

Our analysis shows that the accuracy of a model increases by approximately 80% after adding SMA’s sentiment metrics to the model. Most of the investors are apprehensive of losses so they prefer a model that predicts the losses accurately. It is evident from our analysis that addition of S-Factors decreases the False Positive rate, thus predicting the downward movements of Volatility Indexes accurately.

Our results demonstrate enhanced predictive performance for models that include sentiment factors (S-Factors), using micro blogs like Twitter and StockTwits, as explanatory variables.

As usual, please contact us with any questions: ContactUs@SocialMarketAnalytics.com

Thanks,

Joe