Posts

Social media beats the mainstream media on a regular basis.  Last week social media beat the news wire in reporting the MSFT acquisition of LNKD (blog post below) and Tuesday Twitter broke SCTY being acquired by TSLA.  This information is not theoretical – it is actionable data in our feed!

Tesla Motors lit up Twitter, yesterday, when CEO, Elon Musk came out and said their cars can float on water.  Tuesday June 21, the electric car manufacturer took everyone by surprise when they announced their decision to buy the solar panel company SolarCity (SCTY) minutes after the markets closed. The first news article to mention this came out at 4:18 PM CDT. Twitter had already gotten wind of this development 8 minutes prior with a tweet from the account “TopstepTrader”.

TSLA -SCTY

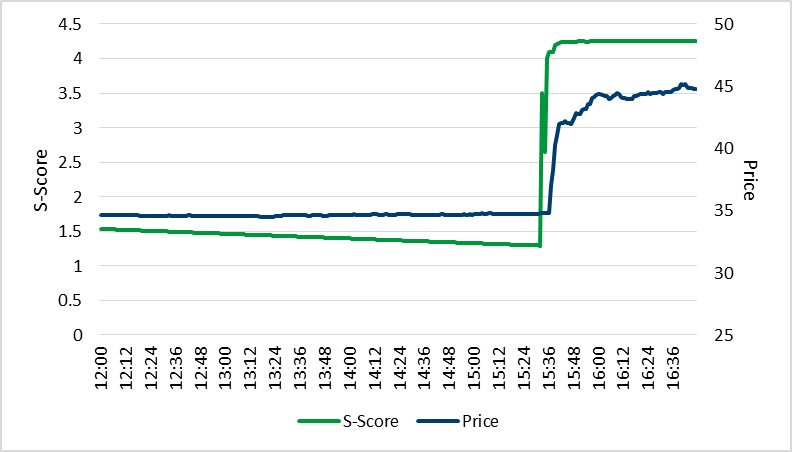
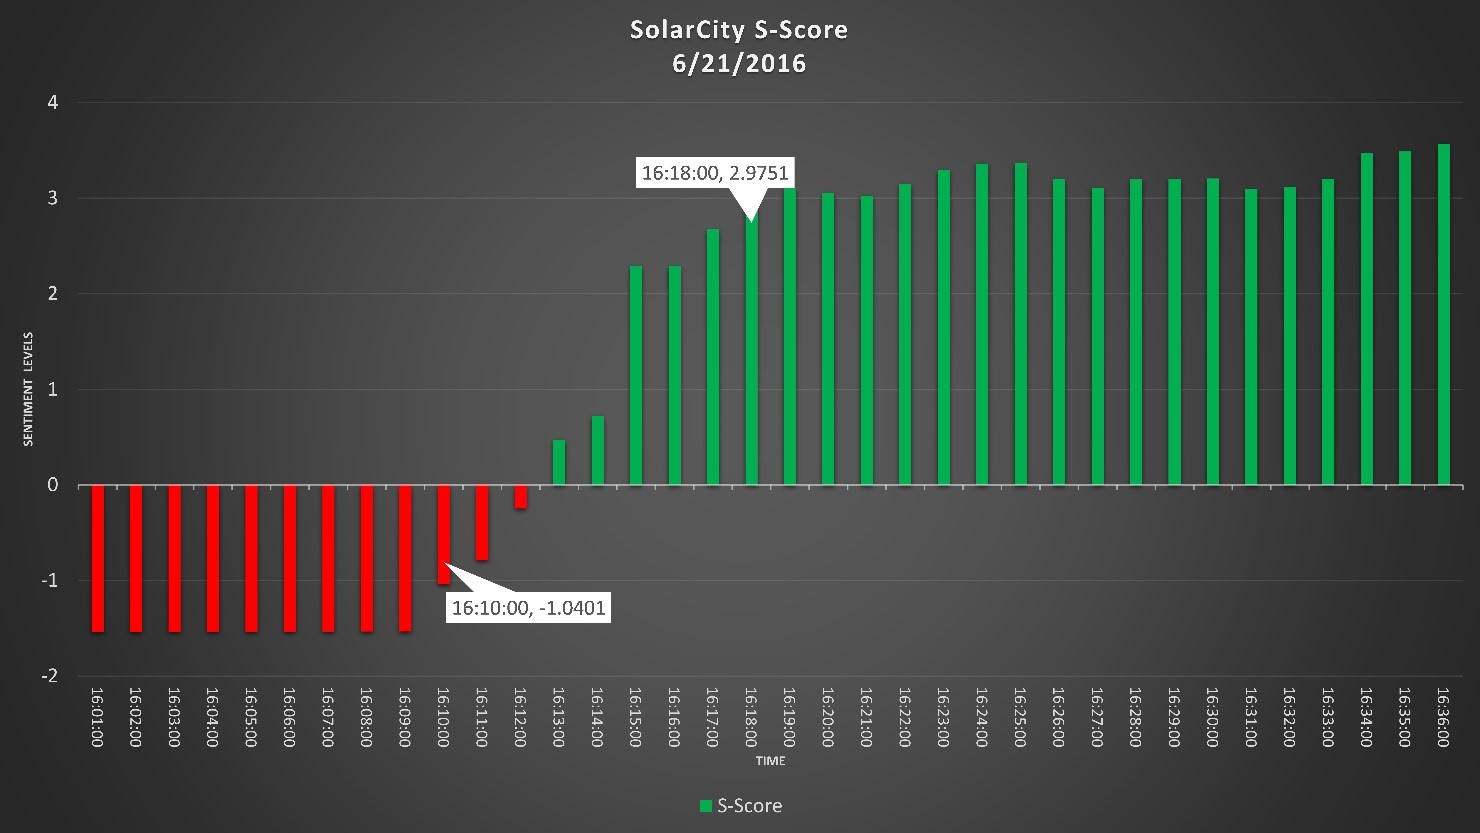
The tweet from “TopstepTrader” was deemed to be credible by Social Market Analytics’ sophisticated algorithm, which separates signal from noise to create actionable intelligence. The sentiment started to move in a positive direction the very next minute. By 16:12 CDT, SMA’s subscribers received ‘S-DeltaTM’ alerts on SCTY. The PredictiveSignalTM from SMA became positive at 16:13 CDT and at 16:18, when the first news article came out, the sentiment had already reached an extremely positive level, with Tweet volume soaring high; as was the stock price. Traders who incorporated social media sentiment from SMA into their trading models were ahead of the curve, making profits as the rest of the market was just learning of the news.

SCTY

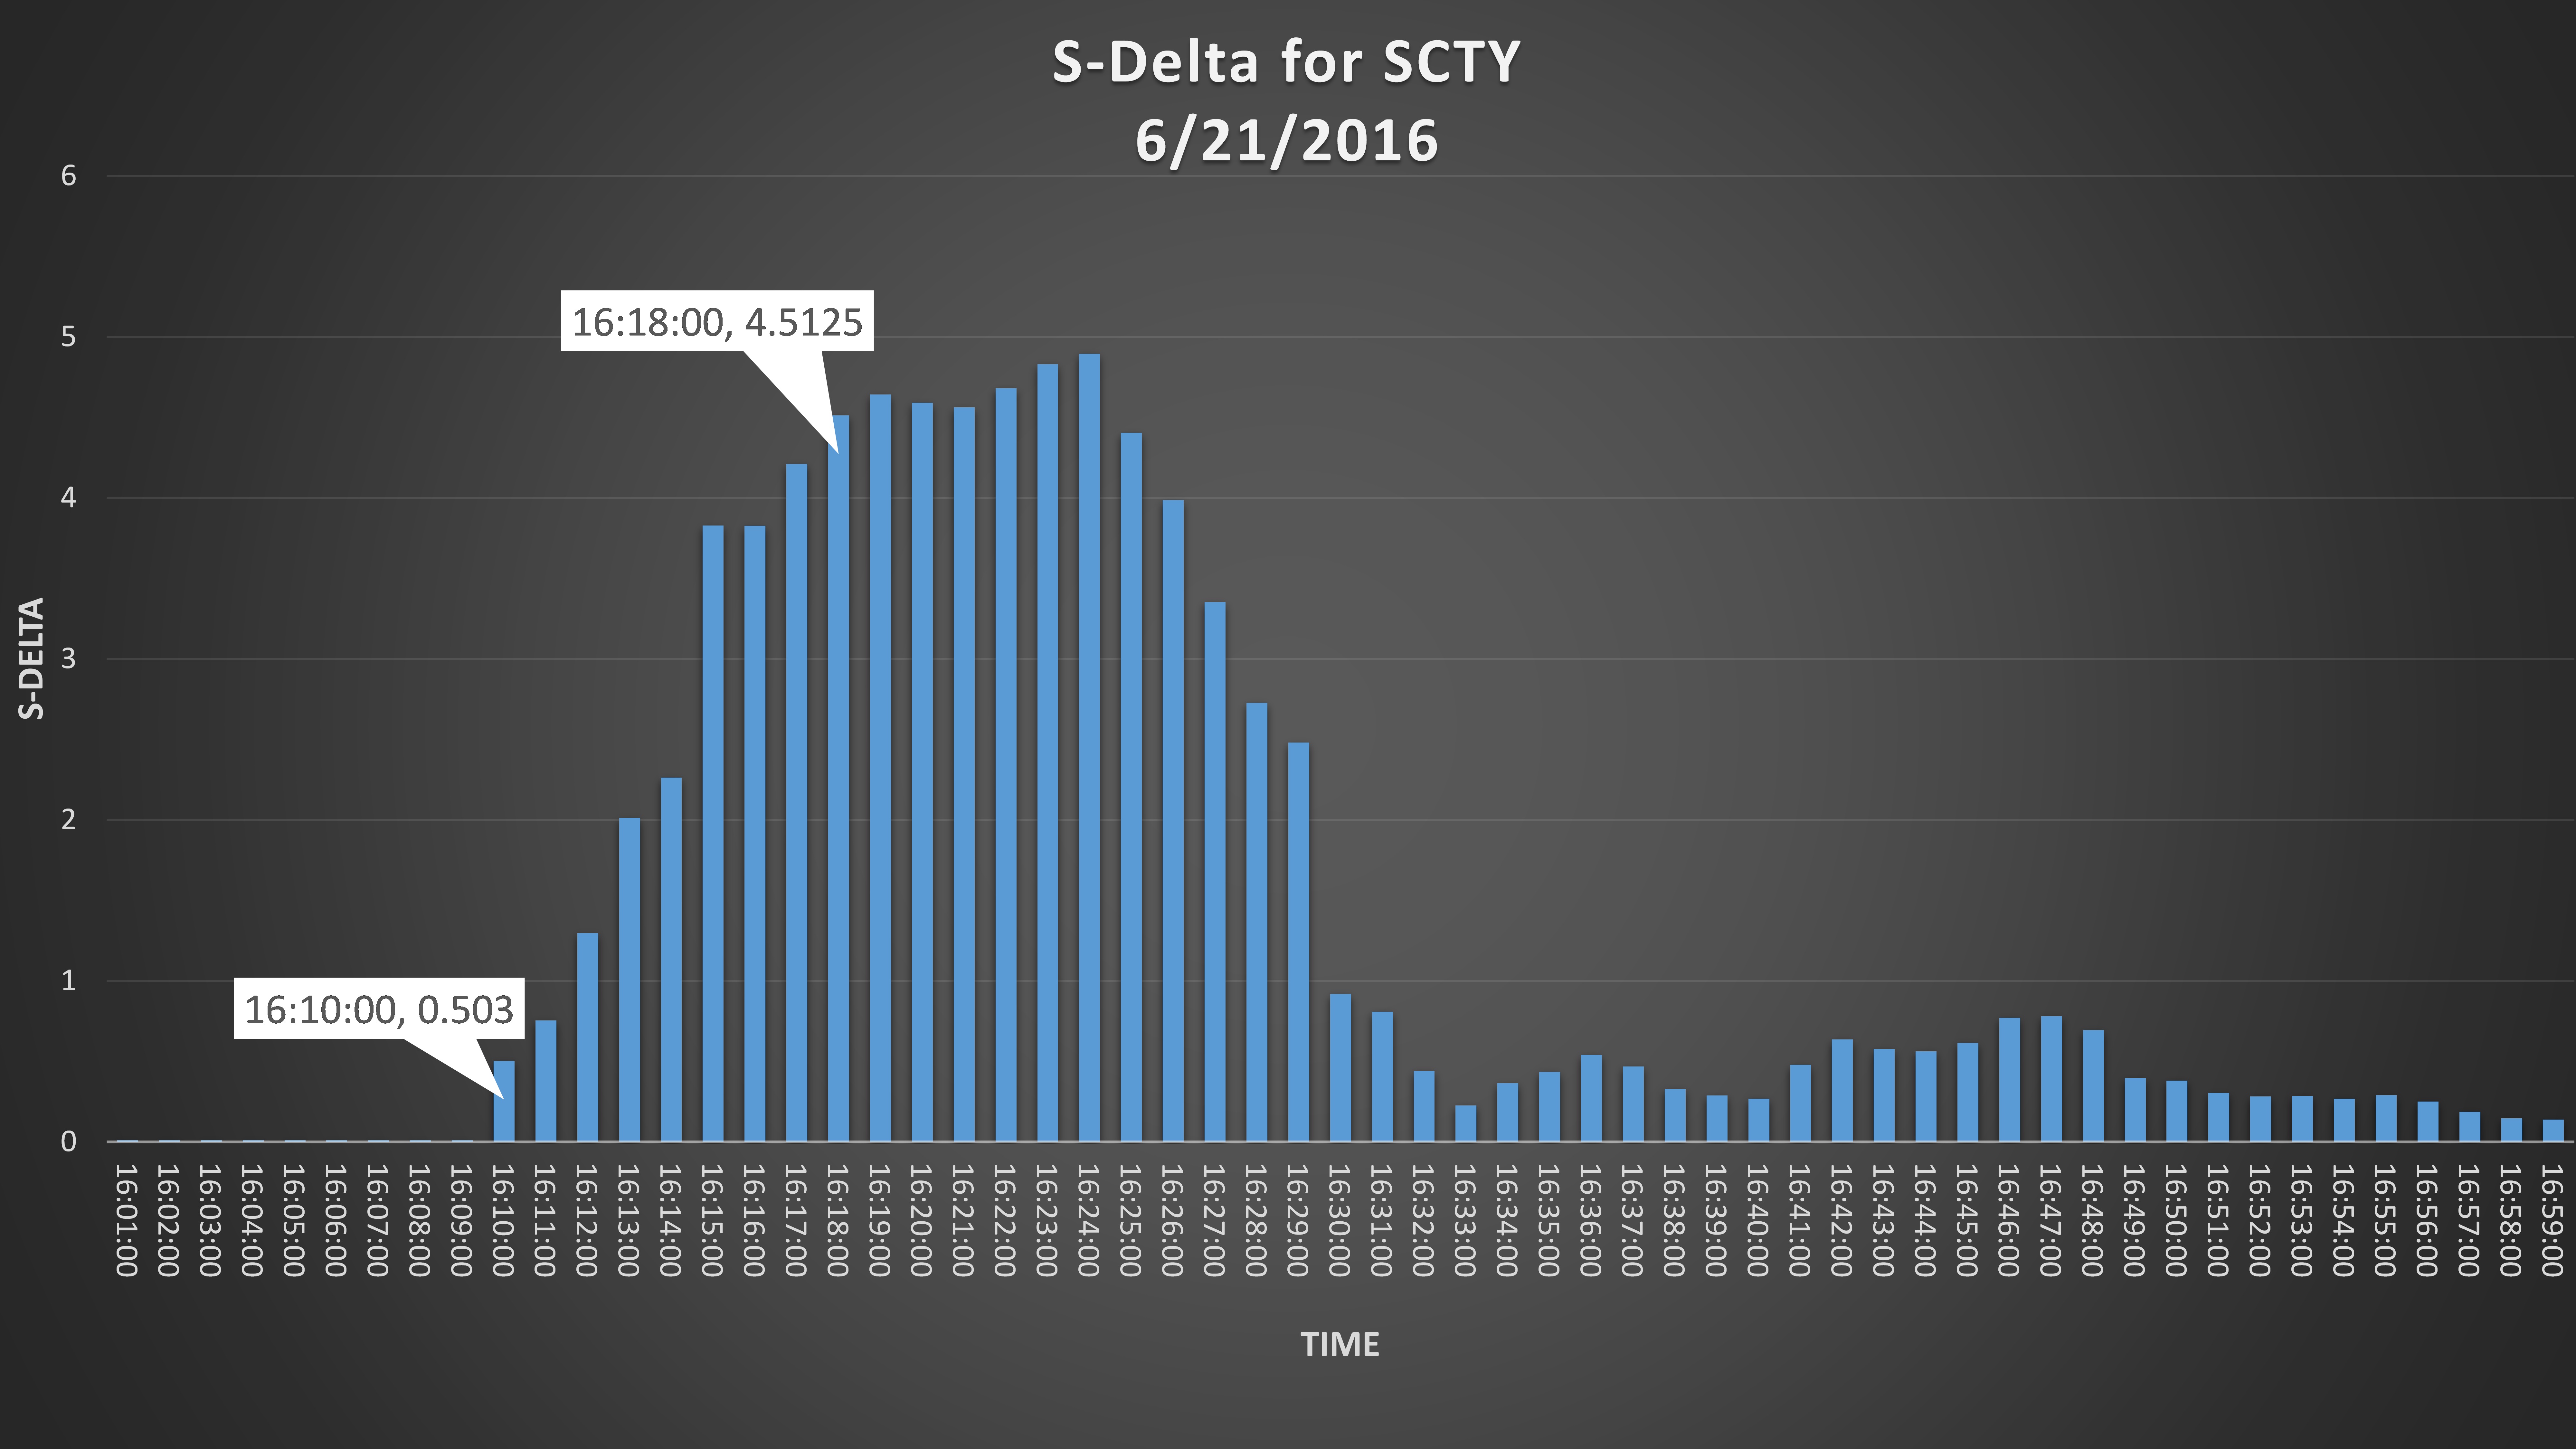
The S-Delta metric also flagged this move.  The below chart illustrates the delta values for SCTY.  Delta represents the change in S-Score over a 15 minute lookback.  Delta values of 2 or higher are huge outliers. An SMA alarm based on Delta or S-Score would have provided an alert to this breaking news.

SCTY_Delta

To find out how you can use SMA S-Factors in your investment process contact us at Info@SocialMarketAnalytics.com


Social Market Analytics (SMA) aggregates the intentions of  investors as expressed on the StockTwits platform.   SMA creates proprietary S-Factor metrics that quantitatively describe the current conversation relative to historical benchmarks.  This data provides strong predictors of future price movement.  This blog will focus on the deterministic nature of the StockTwits data set when aggregated into SMA S-Factors.    StockTwits is a community for active traders to share ideas enabling you to tap into the pulse of the market:  http://stocktwits.com/

The charts and tables below illustrate the subsequent open to close return of stocks that are being spoken about abnormally positively or abnormally negatively on StockTwits twenty minutes prior to market open.  Sharpe and Sortino ratios for the theoretical portfolios are included as well.  The SMA S-Score looks at the current conversation relative to historical benchmarks and creates effectively a Z-Score.

The Green line below is an index of subsequent open to close return of stocks with abnormally positive conversations on StockTwits prior to the market open.  The Red line is an index of the subsequent open to close return of stocks with an abnormally negative conversation prior to market open.  The black line represents the market open to close return and the blue line represents a theoretical long/short portfolio.

These charts clearly illustrate the predictive information present in the StockTwits message stream. If there was no predictive power in the StockTwits data set the Green, Red, and Black lines would be nearly identical -statistically not the case.  These signals are available at 9:10 am Eastern time well before the market open.

The chart below looks at the full SMA history of StockTwits based S-Factors.  The theoretical long portfolio has a Sharpe Ratio of 1.53, theoretical short portfolio -.82 Sharpe and LS portfolio has a Sharpe of 3.68.   Sortino Ratios are above one as well.  There is strong predictive power in this data.

FullHistoryStockTwits

The last year has been particularly challenging for the Hedge Fund community.  Below is a chart with the performance of the theoretical portfolios broken out from 1/1/2015 to current.  As you can see these portfolios performed well in this volatile market period.

LastYearStockTwits

For more information on these data sets please contact Pierce Crosby:  (pierce@stocktwits.com)  or Joe Gits: (joeg@socialmarketanalytics.com)

Regards,

Joe

Wow, what a ride 2015 was with the S&P 500 closing slightly down for the year.  As we head into 2016 are you going to continue to look at the same factors as everyone else or maybe try something new?

Below are the returns for stocks with significantly positive and negative pre-market open S-Scores.   Stocks with High pre-market open sentiment scores had a cumulative return of 12.19% versus an SP 500 open to close return of -.38%.  Stocks with a low pre-market open sentiment score had a cumulative open to close performance of -34%.  Stocks with high sentiment scores outperformed and stocks with low sentiment scores under-performed.  With significant Sharpes and Sortinos.  Combining S-Factors with your selection criteria and risk management can add a dynamic new factor to your security selection.

These charts use the S-Factor S-Score.  SMA publishes and family of S-Factors  to clearly identify the tone of the social media conversation.  To learn more go to: https://socialmarketanalytics.com/process.

returns2015


Returns2015Tables

Returns2015FullHistory

Returns2015FullHistoryTable

Social Market Analytics has been publishing the performance characteristics of stocks with high and low sentiment over the last four years.  Last year it was difficult to find success with traditional factors.  SMA S-Factors helped our customers generate out-performance.   Please contact Social Market Analytics to explore how sentiment based factors can be included in your models: ContactUs@SocialMarketAnalytics.com.


The chart below looks at the percentage of positive Tweets versus the percentage of negative Tweets over the last couple of weeks.  There are usually significantly more positive than negative Tweets so the fact that the negative percentage was so high is valuable data in itself.  As you can see the percentage of negative Tweets increased prior to days with significant market downtrends.

The black lines on the chart represent market activity.   The red and green bars represent negative and positive Tweet percentages.  Sentiment is captured by Social Market Analytics 24×7; you can see the growth in negative sentiment prior to the Monday (8/24 draw down).  On 8/24 the market started strong and fell significantly at session end.

The universe of Tweets is so large that when you aggregate it you get a terrific view of what people believe is going to happen.  This data is only available from Social Market Analytics.  Please contact us for more information on our market leading data sets or visit our Research Page.

PosNegTweets

Thanks,

Joe

Every quarter we review performance returns and statistical ratios for our family of S-Factors.   S-Score is a normalized representation of sentiment over a pre-defined look back period and is a key metric.  Below are some charts that look at the full history and YTD performance of our data across the entire universe.

Anyone can pick specific securities and instances where sentiment leads price movement; it’s a lot harder to consistently predict movements over the entire universe over a long period of time.  We pride ourselves on statistical consistency of our data over what is now 3.5 years of history.    We are the only company to track and publish these metrics, providing the most transparency.

We view S-Score >2 and S-Score <-2 as statistically significant.  An S-score of 2 means the current conversation on social media is more positive than 97 percent of prior conversations as filtered by our proprietary metrics.   When this happens the security moves higher with statistically significant consistency. The green line below represents the full history cumulative open to close return chart of stocks with a high S-Score (S-Score >2) prior to market open.  The Red line represents the full history cumulative open to close return of stocks with an extreme negative S-Score (S-Score <-2) prior to market open.  The black line represents the open to close return of stocks in the SP500.  The Sharpe and Sortino ratios for the green line (Pre-Open S-Score >2) are 1.37 and 2.23 respectively.  Sharpe and Sortino ratios for the red line (Pre-Open S-Score <-2) are -.54 and -.86. Benchmark SP500 Sharpe = .69 and Sortino = 1.08.

FullHistory

Below is the exact same chart for YTD 2015.  Sharpe and Sortino ratios show the benefit of our evolving filtering and scoring criteria.

returnYTD

SharpeYTD

Price and Tweet volume filters are commonly added when filtering stocks for sentiment.  Tweet volume represents indicative Tweet volume, once all Tweets are filtered indicative volume typically represents only 10% of the total volume of Tweets.  The below chart is the same return chart represented above with the added filter of Price day close price >5 and indicative Tweet volume > 5.  As you can see the Sharpe and Sortino ratios increase dramatically by adding simple filters.

PriceVolumeFilter

PriceFilterSort

Social media analytics is a learning process.  Our filtering and cleansing algorithms are continuously evolving.  We maintain our history as it was at each time and we keep dictionaries and accounts as a time series.

We have many more statistics employing other S-Factors and filtering criteria; please contact us for a more detailed briefing on SMA data and products.

Thanks,

Joe

There is a rapidly growing consensus in capital markets that rigorously analyzed information derived originally from social media can be a very valuable input in identifying trading opportunities. Nowhere was this more evident than in what happened to Altera shares on Friday, March 27th. Once news broke at 3:32 PM EDT in a Tweet by a respected Wall Street Journal reporter that Intel was in talks to buy Altera, share prices began to skyrocket…so much so that trading in Altera was halted after only three minutes at 3:35 PM. The story was highlighted in a number of places including The New York Post and CNBC: http://nypost.com/2015/04/02/wall-street-trader-makes-2-4m-thanks-to-a-tweet/ http://www.cnbc.com/id/102545580 But within that very short window a savvy options trader was able to put in a bid for 300,000 options on Altera at $36 per share. At the closing bell that Altera’s price was $44.39. The trader cleared just over $2.4 Million…not bad for an afternoon’s work. It is not clear what the exact mechanism was that enabled this trader to pull off such a spectacular trade….perhaps just great timing, perhaps using some sort of sophisticated model that incorporates input derived from conventional news sources and/or social media. But, what we know at Social Market Analytics (SMA) is that our analysis tracked this spectacular deal perfectly. SMA clients use our Sentiment (or S-) Factors as key inputs into the trading models they use. The graphic below illustrates what SMA analytics predicted what would happen.  Tweet time is central time.  Chart is based on Eastern time.  Our signal reacted well before the price move. Altera Tweet

The below chart overlays the SMA signal and price. Our SMA S-Score reacted significantly before the price changed happened.  Definitely time for SMA customers to act! SMA Signal and Price

This functionality is only available through SMA – Contact us for more details. Thanks, Joe