You are here: Home / social media
Posts
https://www.socialmarketanalytics.com/wp-content/uploads/2018/06/sma-logo.svg
0
0
SMA Team
https://www.socialmarketanalytics.com/wp-content/uploads/2018/06/sma-logo.svg
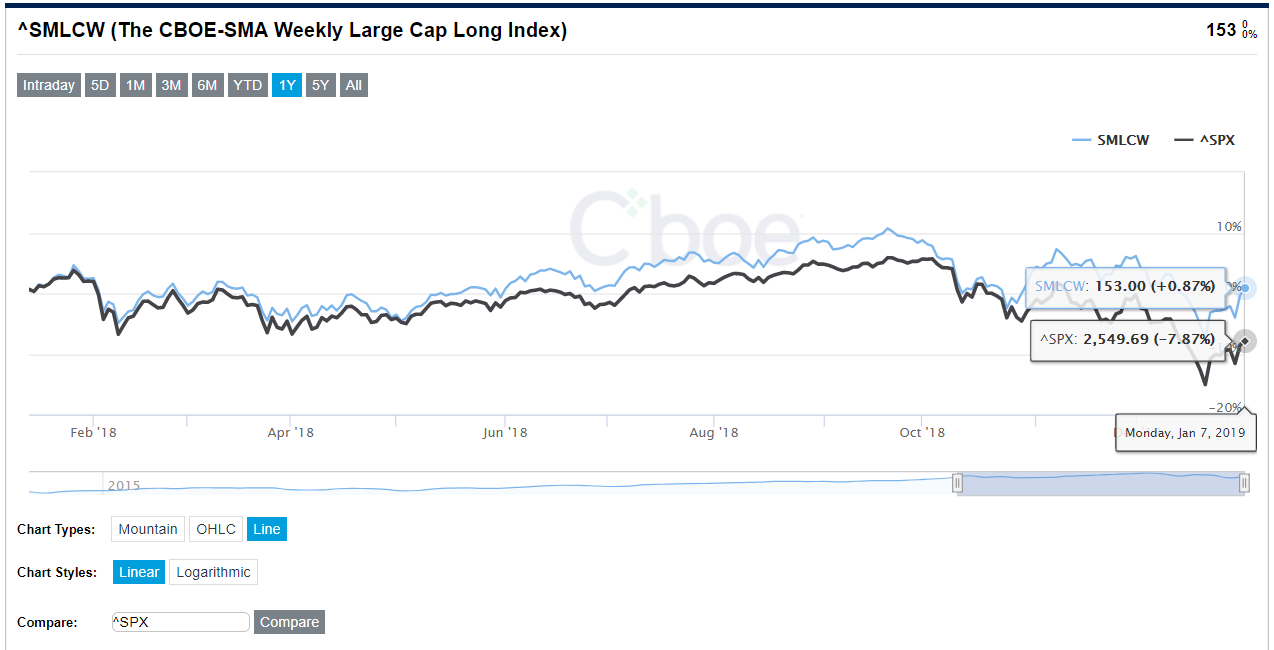
SMA Team2019-01-08 16:17:472020-06-30 20:38:39CBOE - Social Market Analytics SMLCW Index significantly outperforms.
https://www.socialmarketanalytics.com/wp-content/uploads/2018/06/sma-logo.svg
0
0
Joe Gits
https://www.socialmarketanalytics.com/wp-content/uploads/2018/06/sma-logo.svg
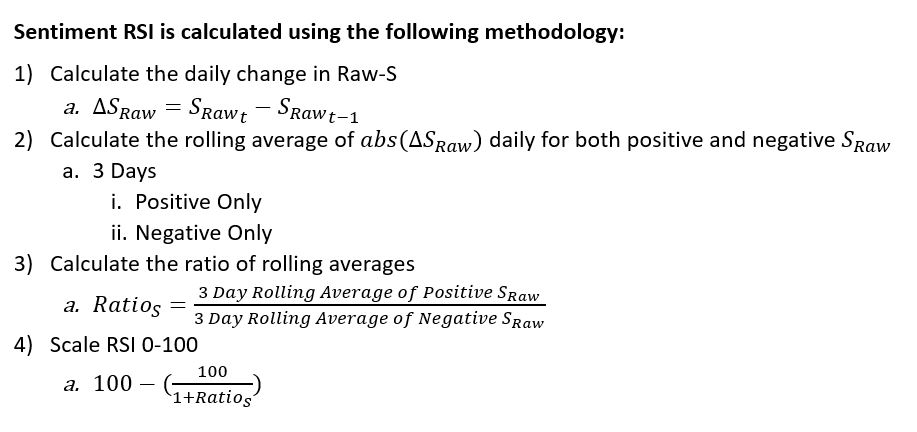
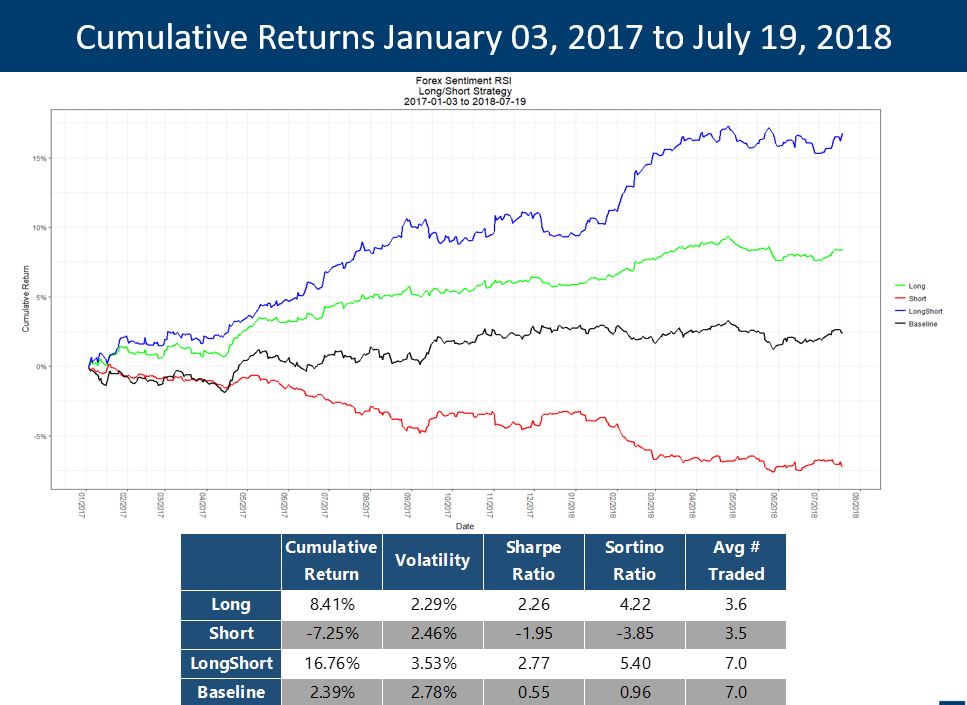
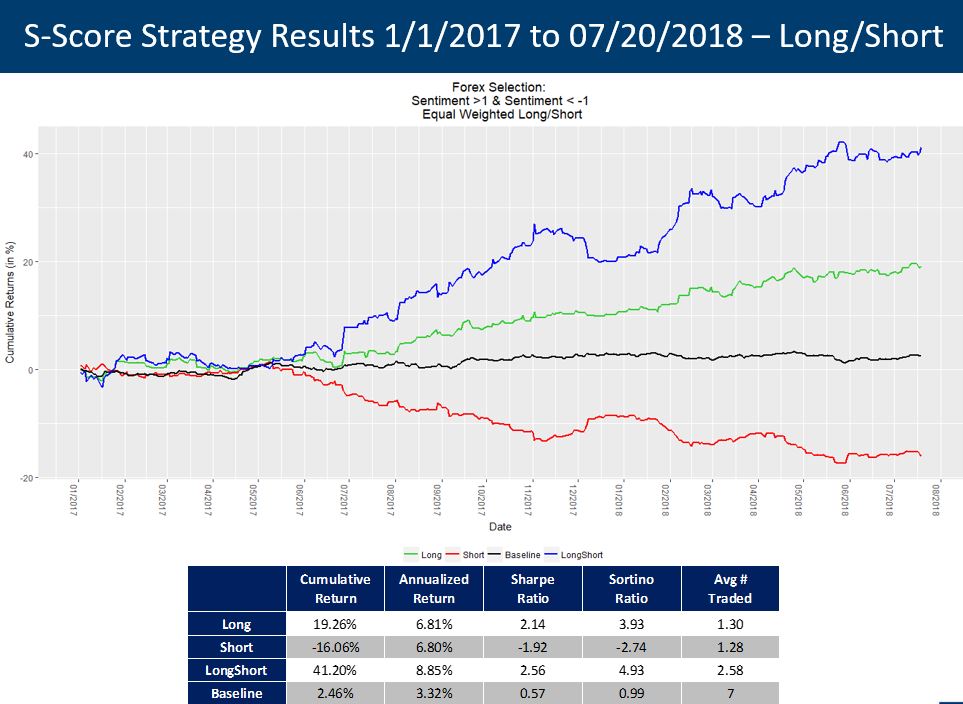
Joe Gits2018-09-20 19:52:112018-09-20 19:52:11Social Market Analytics Sentiment Data for Forex Trading
https://www.socialmarketanalytics.com/wp-content/uploads/2018/06/sma-logo.svg
0
0
Joe Gits
https://www.socialmarketanalytics.com/wp-content/uploads/2018/06/sma-logo.svg
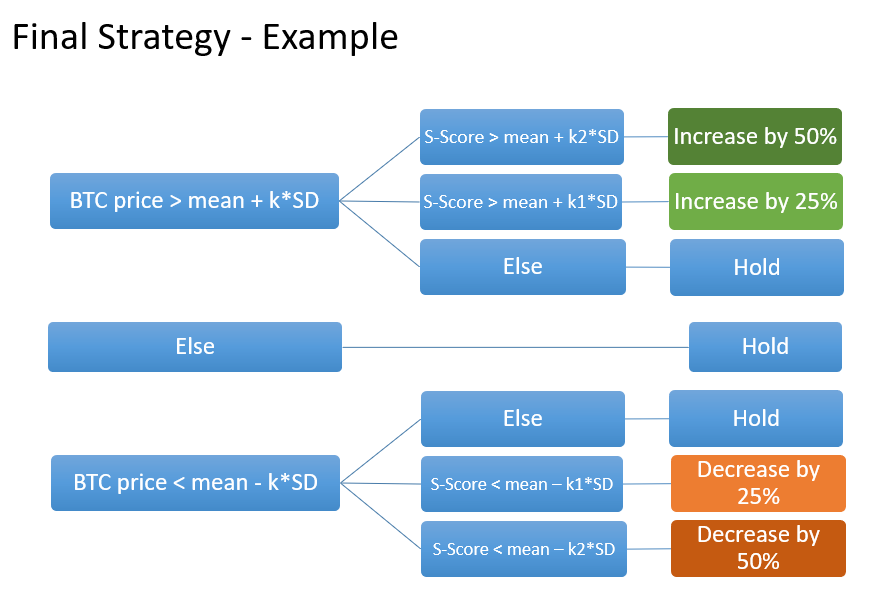
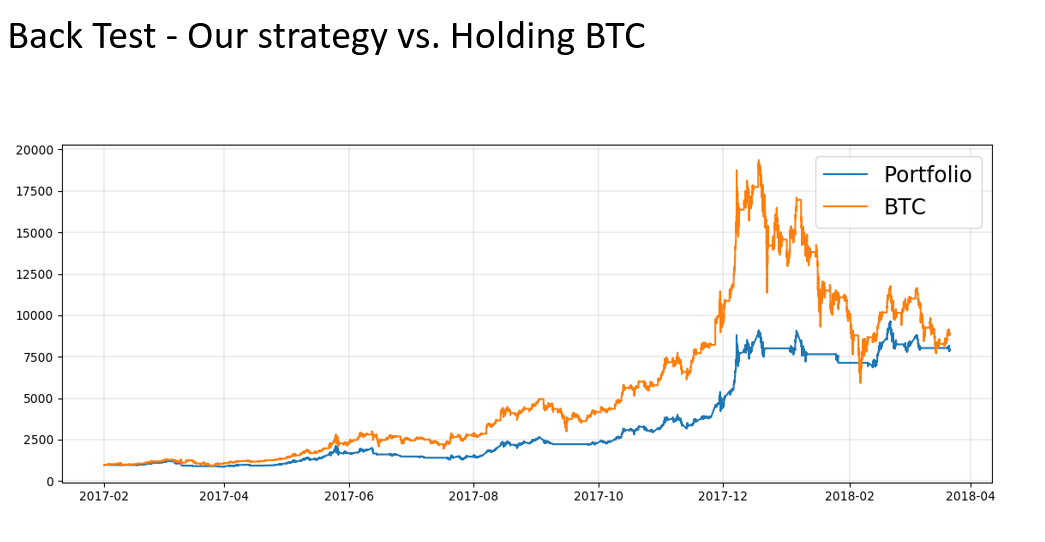
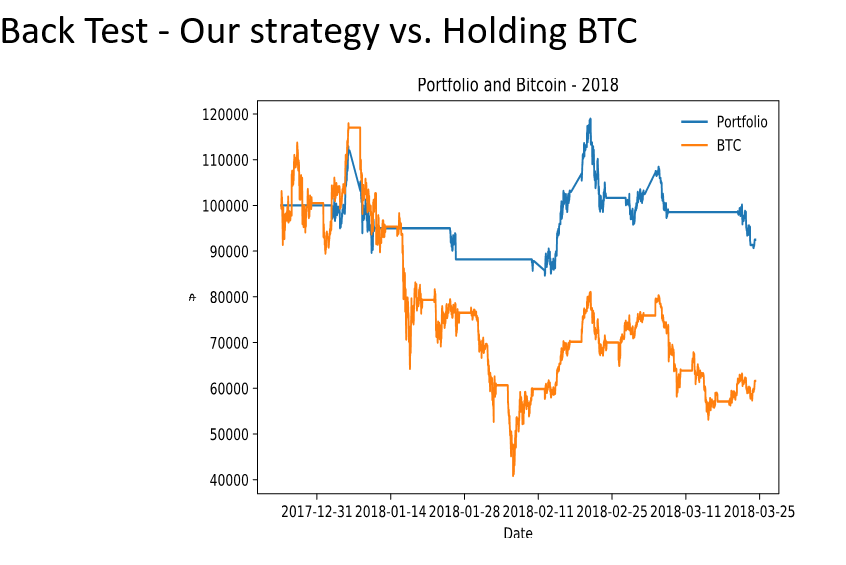
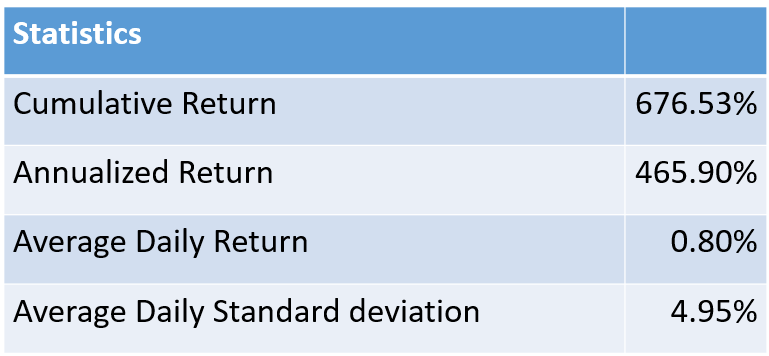
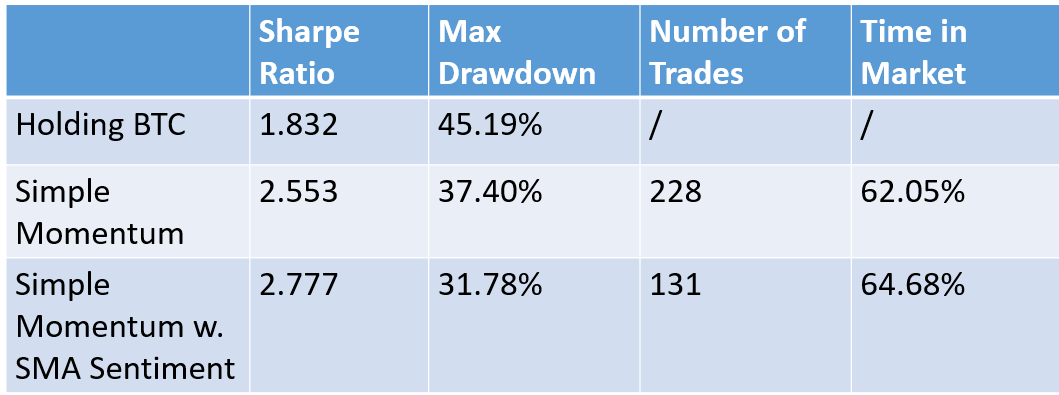
Joe Gits2018-05-03 18:59:432018-05-03 18:59:43UIUC Bitcoin Trading System Practicum Presentation
https://www.socialmarketanalytics.com/wp-content/uploads/2018/06/sma-logo.svg
0
0
Joe Gits
https://www.socialmarketanalytics.com/wp-content/uploads/2018/06/sma-logo.svg
Joe Gits2017-12-05 19:56:152017-12-05 19:56:15Social Market Analytics Now Has Six Years of Out-Of-Sample History!
https://www.socialmarketanalytics.com/wp-content/uploads/2018/06/sma-logo.svg
0
0
Joe Gits
https://www.socialmarketanalytics.com/wp-content/uploads/2018/06/sma-logo.svg
Joe Gits2017-04-21 19:10:462017-04-21 19:10:46Joe Gits talks Twitter at CBOE's Risk Management Conference
https://www.socialmarketanalytics.com/wp-content/uploads/2018/06/sma-logo.svg
0
0
Joe Gits
https://www.socialmarketanalytics.com/wp-content/uploads/2018/06/sma-logo.svg
Joe Gits2017-03-10 17:33:502017-03-10 17:33:50Decile Spreads for Twitter & StockTwits
https://www.socialmarketanalytics.com/wp-content/uploads/2018/06/sma-logo.svg
0
0
Joe Gits
https://www.socialmarketanalytics.com/wp-content/uploads/2018/06/sma-logo.svg
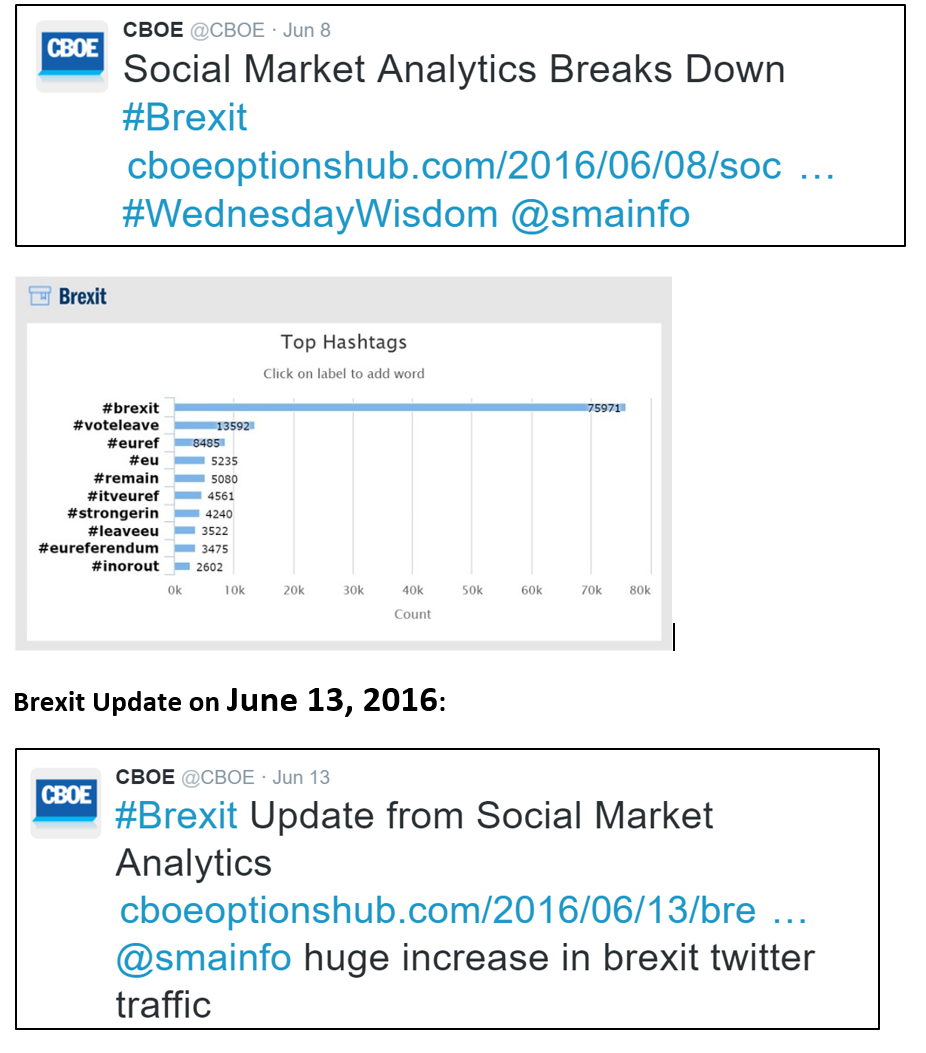
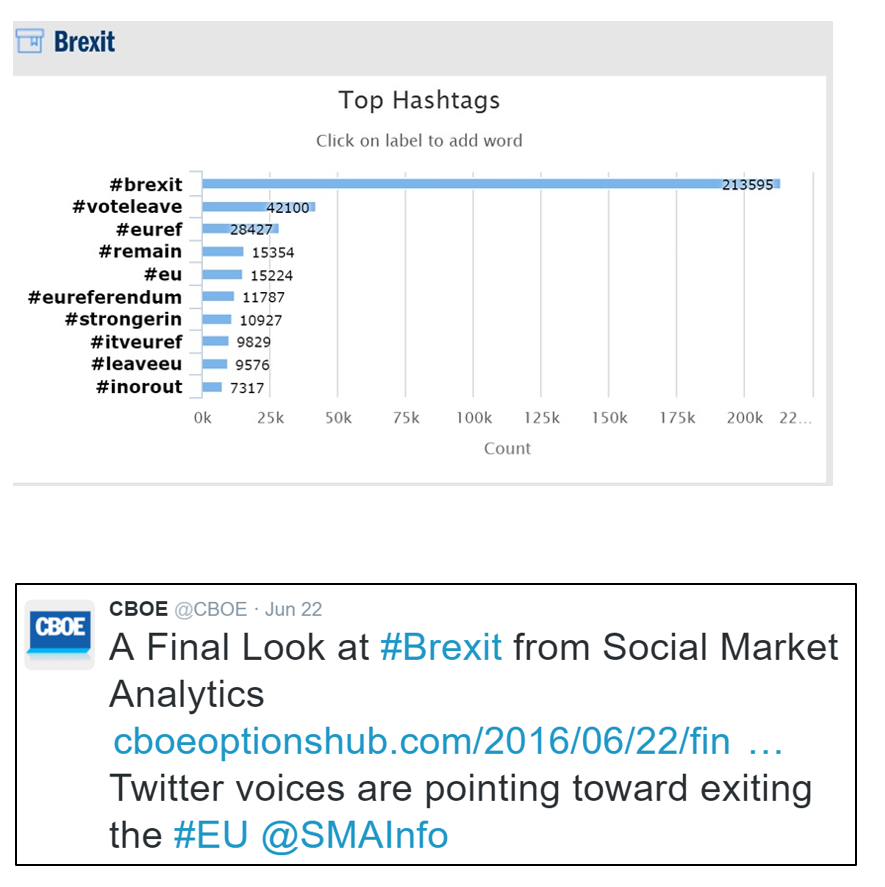
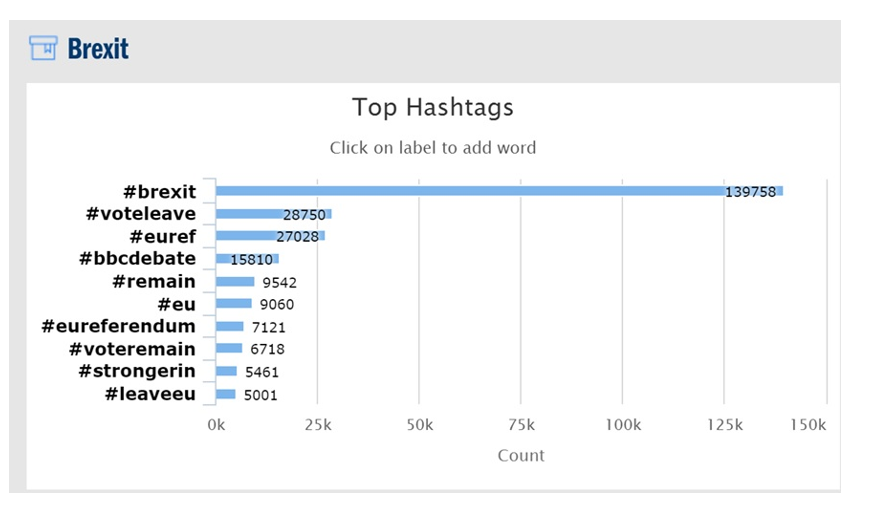
Joe Gits2016-06-24 19:02:122016-06-24 19:02:12SMA Predicts Brexit Two Weeks Before The Vote
https://www.socialmarketanalytics.com/wp-content/uploads/2018/06/sma-logo.svg
0
0
Joe Gits
https://www.socialmarketanalytics.com/wp-content/uploads/2018/06/sma-logo.svg
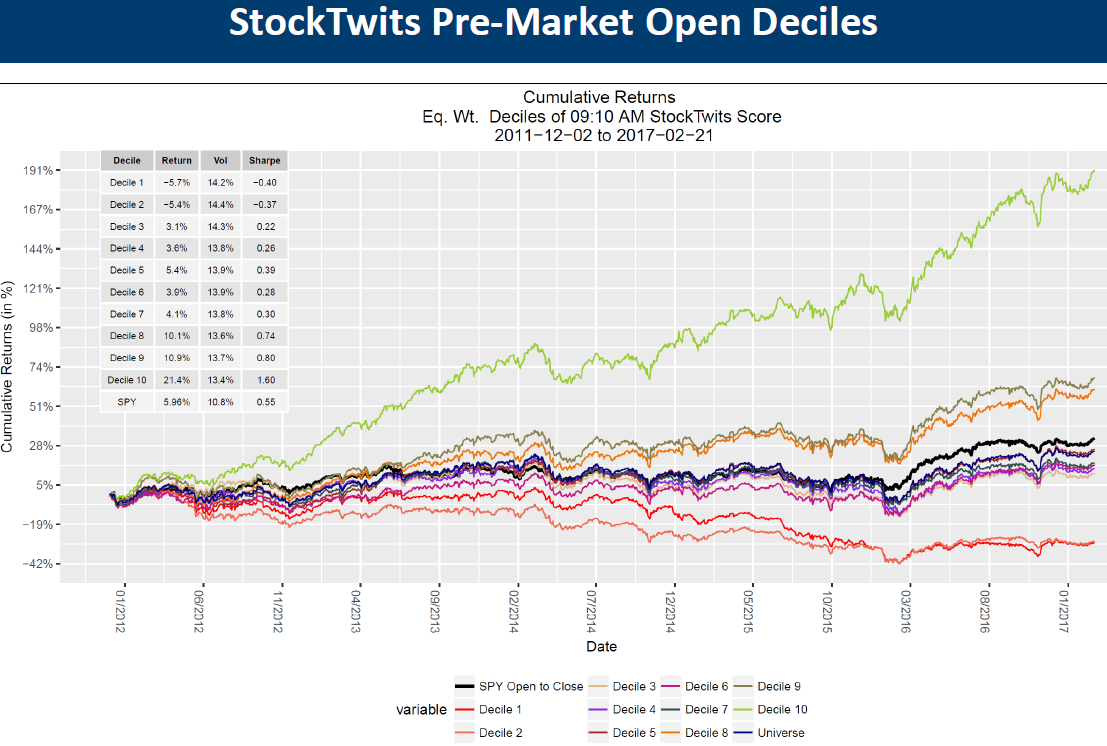
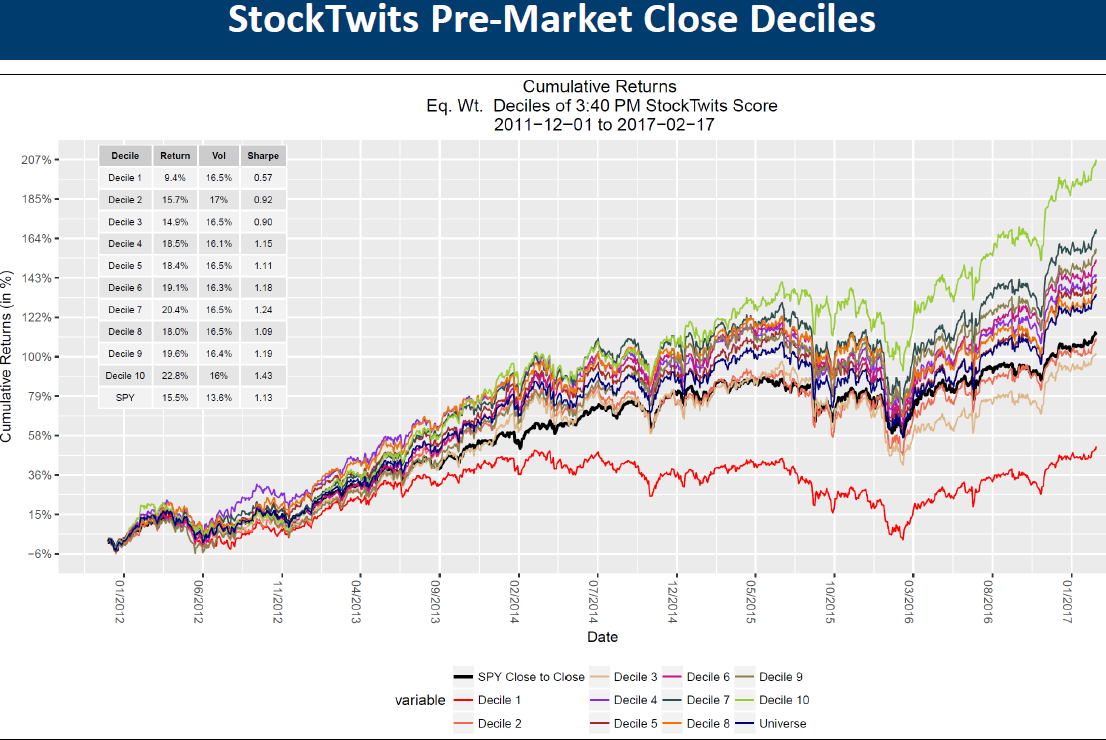
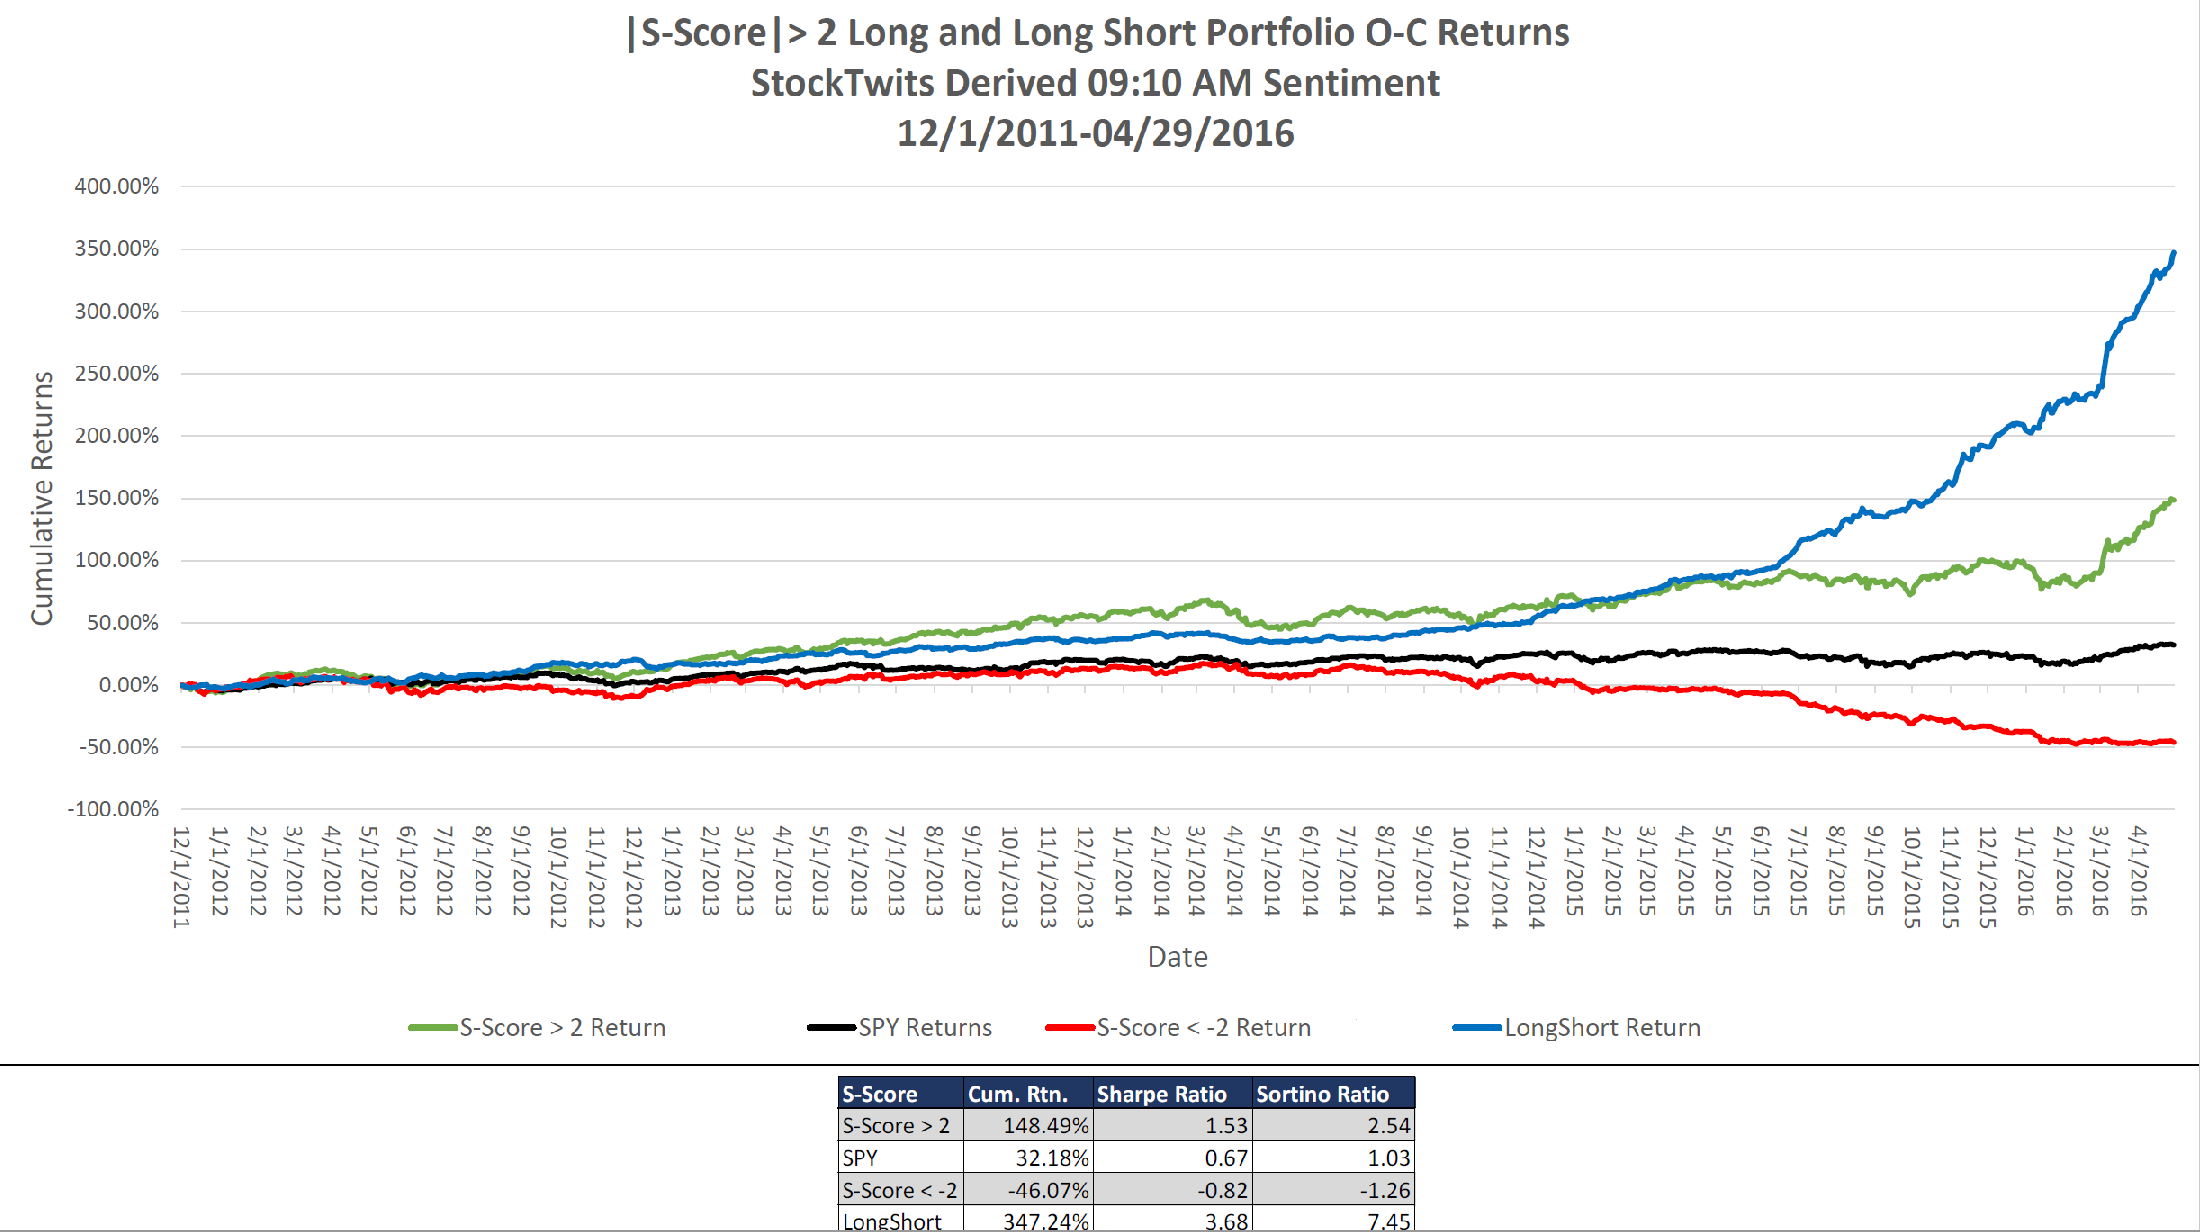
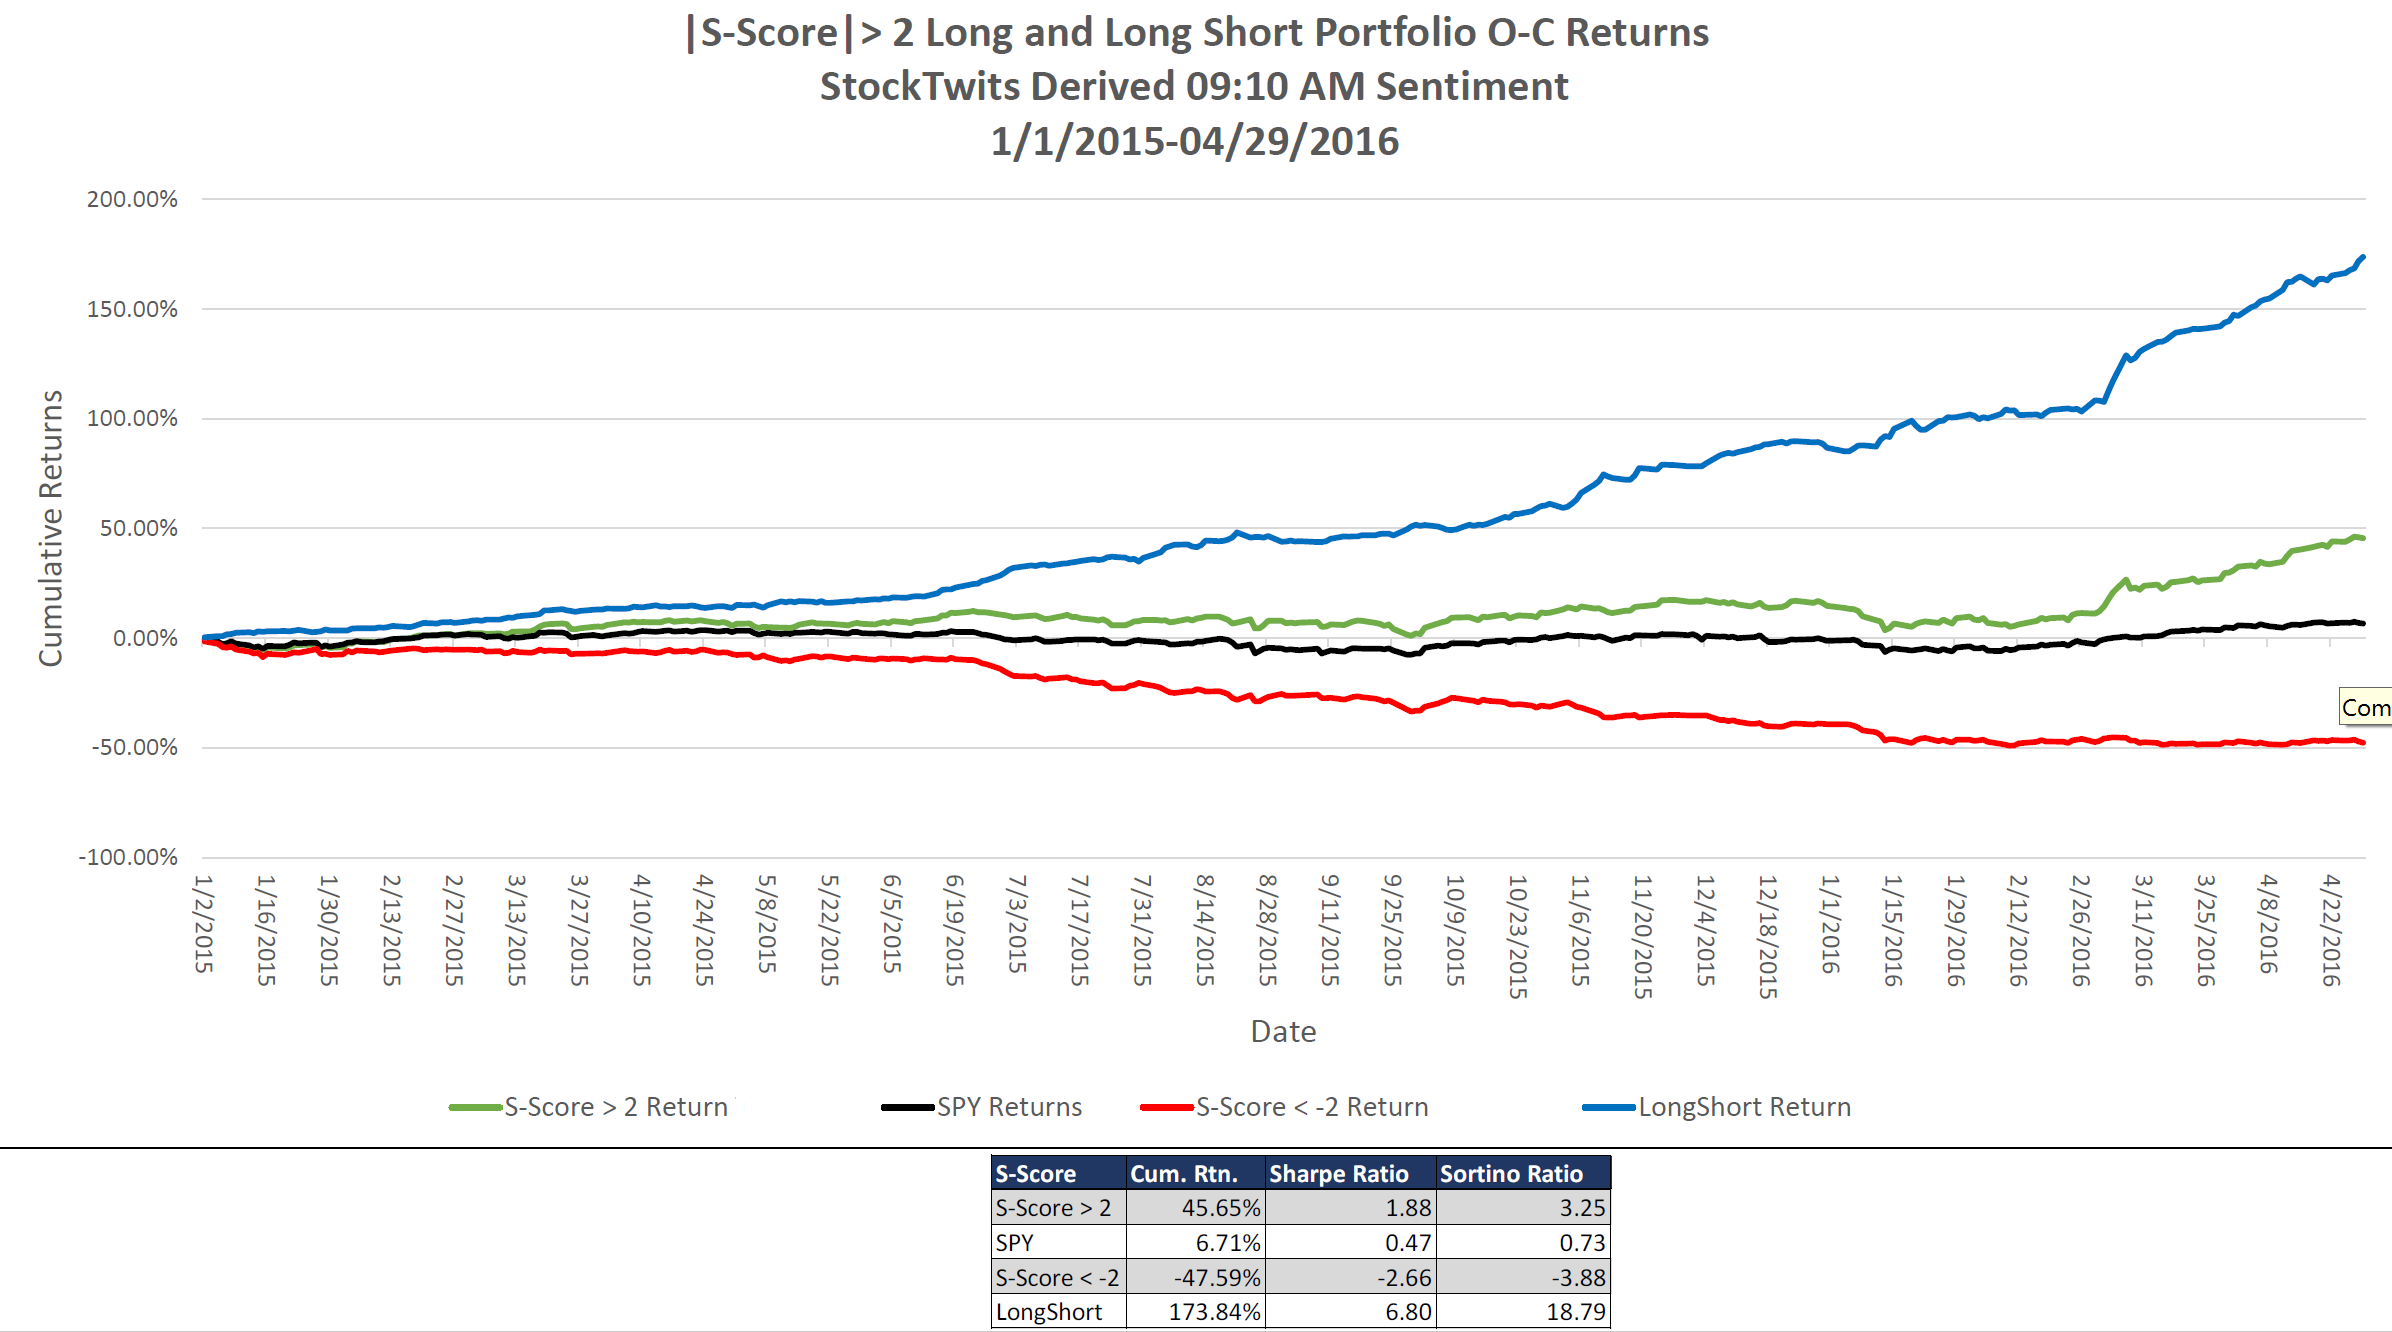
Joe Gits2016-05-13 19:15:322016-05-13 19:15:32StockTwits based S-Factor Return Charts
https://www.socialmarketanalytics.com/wp-content/uploads/2018/06/sma-logo.svg
0
0
Joe Gits
https://www.socialmarketanalytics.com/wp-content/uploads/2018/06/sma-logo.svg
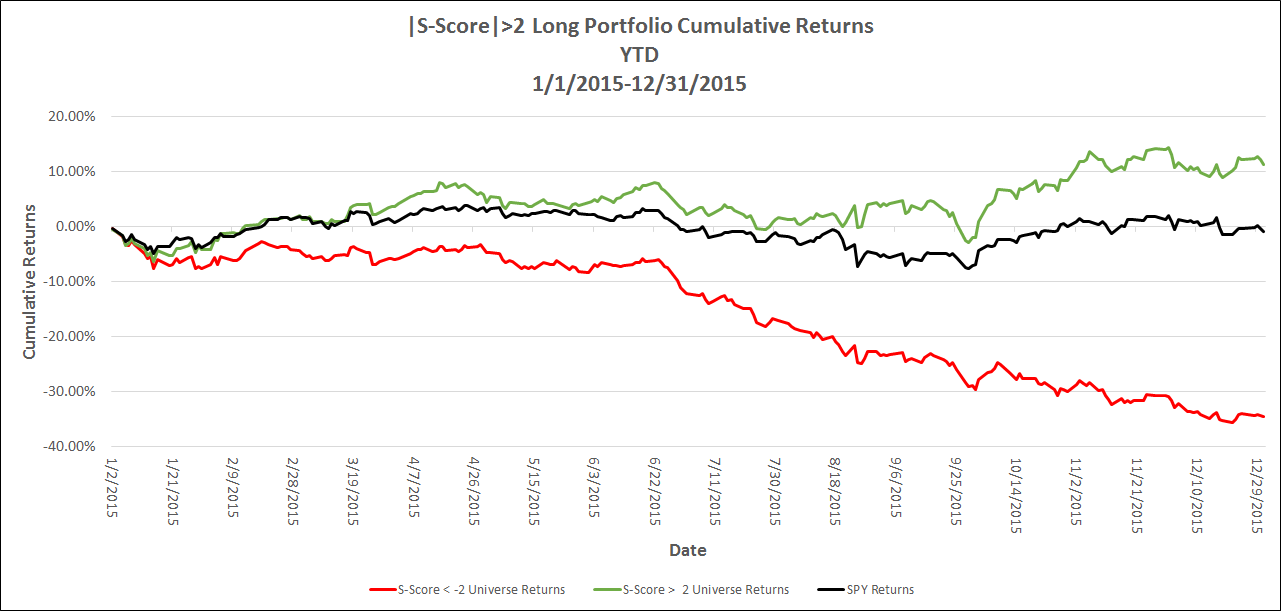
Joe Gits2016-01-04 15:15:132016-01-04 15:15:132015 In Review
https://www.socialmarketanalytics.com/wp-content/uploads/2018/06/sma-logo.svg
0
0
Joe Gits
https://www.socialmarketanalytics.com/wp-content/uploads/2018/06/sma-logo.svg
Joe Gits2015-10-27 15:03:012015-10-27 15:03:01Social Media and Smart Beta
Scroll to top