Posts

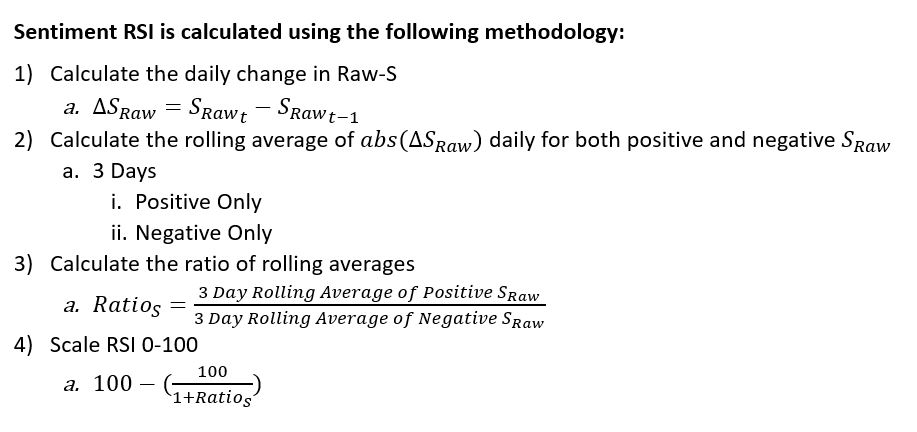
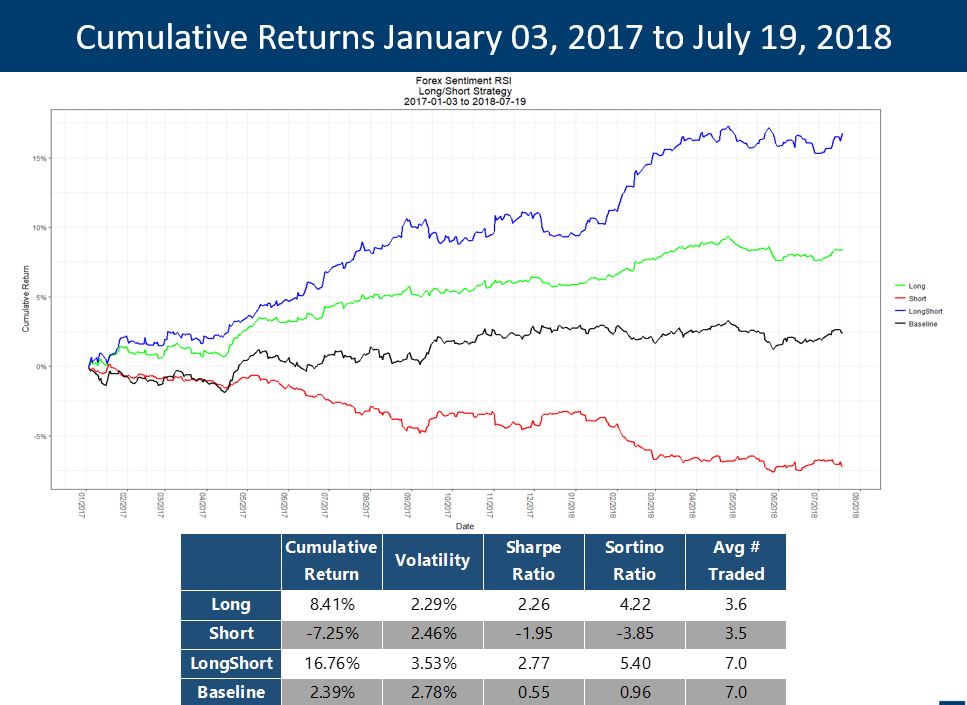
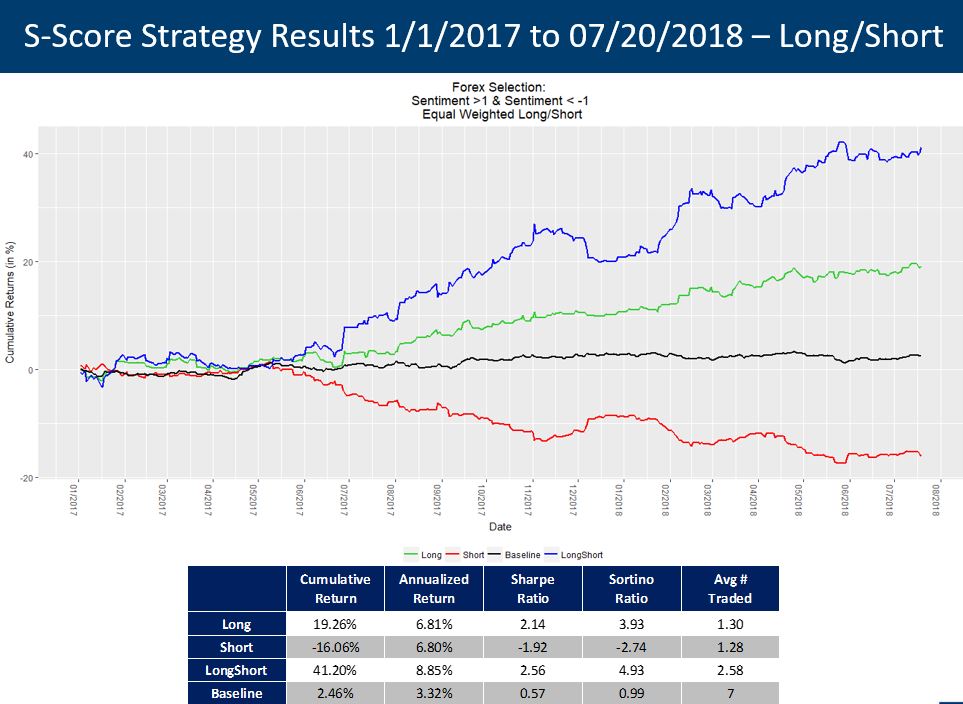
Social Market Analytics, Inc. (SMA) partnered with the Cboe in January 2017 to release the SMLCW Index ‘Cboe – SMA Large Cap Weekly Index’. The SMLCW Index is a Long Only Index that has outperformed since it was released and has continues to outperform in the recent market volatility and sell-off. In the chart below the S&P500 is flat for the year and SMLCW is up nearly 5% YTD.

SMA has two U.S. Patents around its machine learning and NLP processes that produce predictive analytics at the security level across U.S. and UK stocks, ETFs, FX, Futures, and Crypto Currencies

The SMLCW portfolio is an equally-weighted Long Only portfolio of 25 stocks drawn from the CBOE Large-Cap Universe with the highest average 5-period S-Scores. Stocks in this universe (a) are in the top 15% capitalization tranche of stocks that are the underlying for options listed on the CBOE (approximately 3000 stocks) and (b) have a market capitalization greater than or equal to $10 billion.

SMLCW YTD

The CBOE Large-Cap Universe is reconstituted quarterly on the third Friday of the month. The SMLCW portfolio is reconstituted every Friday at 8:30 am CT, based on average 5-period SMA S-Scores at 8:10 am CT. A period is a date on which there is sufficient social media data to derive SMA S-Scores. Stocks are deemed sold and purchased at market-on-open prices. The portfolio is held until 8:30 am CT on the next Friday. If Friday is a business holiday, the portfolio is rebalanced on the preceding Thursday.

To learn more, visit SMA at www.socialmarketanalytics.com or the Cboe website at http://www.cboe.com/products/social-media-indexes


Social Market Analytics (SMA)  provides real-time sentiment data for equities (North America & LSE), commodities, foreign exchange, Crypto Currencies and ETF’s.

In this blog I am going to explore a trading system using the SMA Twitter based sentiment data to trade a basket of: EURUSD, EURGBP, GBPJPY, GBPUSD ,USDCAD ,USDCHF ,USDJPY.

We will explore two straight forward trading systems:

  • Forex Sentiment RSI: Daily Long/Short Strategy
  • SMA S-Score Based Currency Selection Model

RSI Calculation Methodology 

CurrencyBlog 1

This strategy is a single-factor model solely based on adjusting daily weights according to 3-Day Sentiment RSI on the 7 of the highest daily volume Forex pairs. It is long-short with the assumption that tails act with similar magnitude.

  • Long/Short
    1. RSI >= 50, Long
    2. RSI < 50, Short
  • 50% Long & 50% Short Asset Allocation
    1. Long weights are calculated using only longs
    2. Short weights are calculated using only shorts
  • Daily weight adjusted following:
    1. separately for the long side and the short side


currencyBlog2

The strategy significantly improves returns compared to an equal weighted baseline.  Sharpe and Sortino ratios are statistically significant:

  • Sharpe Ratio:
    • 2.77 Jan 03, 2017 to July 19, 2018
    • 3.40 YTD
  • Sortino Ratio:
    • 5.40 Jan 03, 2017 to July 19, 2018
    • 7.46 YTD

The volatility of each leg of the strategy is either kept stable or decreased in comparison with the baseline.

SMA S-Score Based Currency Selection Model

This daily trading strategy is based on the S-Score at 09:10:00 EST and executing a 24-hour hold based on these values at 09:15:00 EST. We find consistency across execution times.  The goal is to assess sentiment and take make a directional trade in agreeance, given that the sentiment falls at least 1 standard deviation from the 20-day mean.

Equal weighted based on standard deviation criteria:

– Long: S-Score > 1

– Short: S-Score < -1

– Baseline: Equal Weighted Portfolio of the 7 Currency pair

Long and short legs are capped at 50% of the daily portfolio, even on the occurrence of an outlier day where all pairs are long, or all pairs are short.

currencyBlog3


The strategy drastically improves returns compared an equal weighted baseline.  Up to 40% cumulative over a 19-month period with a consistent annual rate of return.

  • Sharpe Ratio:
    • 2.56 Jan 03, 2017 to July 19, 2018
    • 3.56 YTD
  • Sortino Ratio:
    • 4.93 Jan 03, 2017 to July 19, 2018
    • 7.72 YTD

These are straight forward strategies that illustrate the predictive nature of our dataset.  Twitter and StockTwits based factors.  To learn more about how Social Market Analytics sentiment data can help your trading please contact us at contactus@Socialmarketanalytics.com or Doug Hopkins @ (312) 788-2621.